 Facebook
 X
X
 Pinterest
 Copy Link
How’s the Market? Year End Review of Seattle Area Real Estate in 2025

Home values held steady in 2025 with many communities seeing modest price gains. Seattle Metro’s median sale price and $ per sq. ft. both rose year-over-year, while the Eastside’s numbers remained similar to what we saw in 2024. Both areas saw double-digit spikes in the number of new listings and a slight slowdown in the number of sales.
Looking forward: this is a great year to invest! We’ve had a few back-to-back years of soft price gains, which feel like losses in our frequently HOT Seattle. This is as close to a “buyer’s advantage” market as we’ve seen in years. At the time of writing this, interest rates are available in the high 5’s. The cost of money is reasonable and the cost of property has not risen drastically in a few years. This is the perfect time to jump in for investors and first-time buyers. More specifically, anyone who can buy “unburdened” or without having to sell/carry two mortgages in order to buy. The condo and townhome markets continue to be a great opportunity for those looking to take the first step onto the property ladder. If none of this applies to you, remember: if you’re looking to buy and sell within the same market, you only get an advantage on one side.
Click or scroll down to find your area report:
Seattle | Eastside | Mercer Island | Condos | Waterfront
SEATTLE
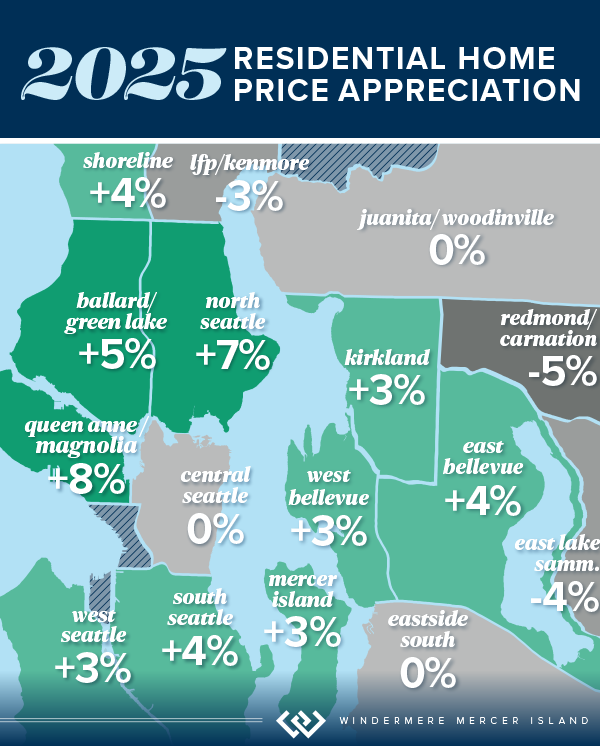
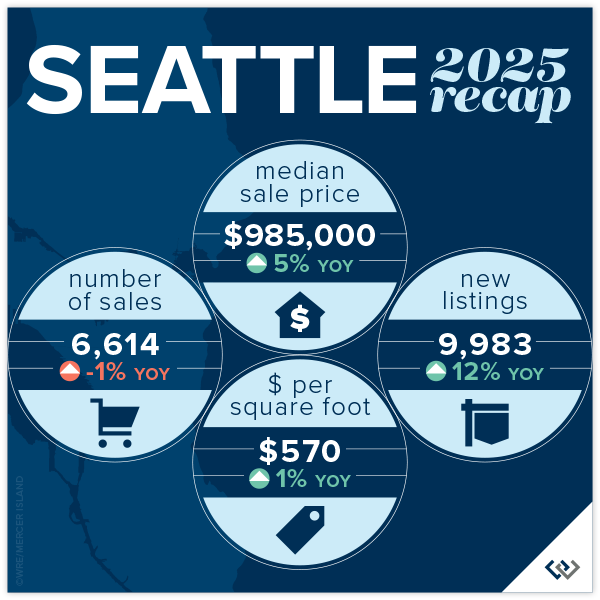
It’s all good news in the city of Seattle! The median price rose by 5% to $985,000. Pricing remained competitive, with 64% of homes selling at or above their list price (despite the fact that new listings increased 12% from 2024 and the number of sales dipped slightly).
Sales activity moved quickly in many neighborhoods. Citywide, 55% of homes sold within the first 10 days on market. Several areas posted strong performance, including Ballard & Green Lake with 1,705 homes sold, and North Seattle with 1,040 sales. Median prices varied by neighborhood, ranging from $794,000 in South Seattle to $1,399,000 in Queen Anne & Magnolia, reflecting the diversity of Seattle’s housing market.
Remember, these statistics include new construction data. In an inventory-constricted market, new construction data can skew pricing stats significantly. Check with your agent for how this affects your neighborhood.
Click here for the full report and neighborhood-by-neighborhood statistics!

EASTSIDE
Across the Greater Eastside, 5,458 homes sold during the year, down 5% compared to 2024. New inventory increased, with 8,259 new listings coming to market—up 16%! Fifty-five percent of homes sold at or above their list price, and 53% sold within the first 10 days on market, highlighting consistent transaction pace and buyer confidence across the region. Despite this, the median sale price held flat at $1,599,000 compared to 2024, while homes sold for an average of $688 per square foot, also similar to last year.
Several communities recorded notable activity levels, including Woodinville with 1,235 homes sold and East of Lake Sammamish with 1,134 sales. East Bellevue saw a 13% increase in homes sold, while Redmond posted a 15% increase in sales volume. Median sale prices varied by community, ranging from $1,281,000 in Woodinville to $3,688,000 in West Bellevue, reflecting the diversity of the Eastside housing market.
Several communities recorded notable activity levels, including Woodinville with 1,235 homes sold and East of Lake Sammamish with 1,134 sales. East Bellevue saw a 13% increase in homes sold, while Redmond posted a 15% increase in sales volume. Median sale prices varied by community, ranging from $1,281,000 in Woodinville to $3,688,000 in West Bellevue, reflecting the diversity of the Eastside housing market.

Click here for the full report and neighborhood-by-neighborhood statistics!
MERCER ISLAND
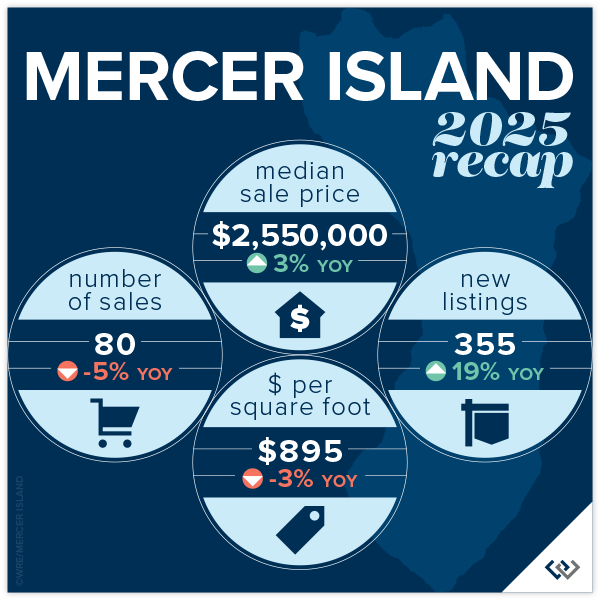
The 2025 Mercer Island real estate data reflects a year of steady activity and modest price gains. Median home prices rose 3% year over year to $2,550,000. Homes sold for an average of $895 per square foot, and half of all homes sold at or above their list price. Sales moved efficiently, with 56% of homes selling within the first 10 days on market.
A total of 80 single-family homes sold on Mercer Island during the year. Activity varied by neighborhood, with sales recorded across Northend, Southend, Mid-Island, First Hill, Westside, and The Lakes. Median home prices ranged from $1,775,000 in Mercerdale to $5,831,000 on the Westside, highlighting the range of housing options across the island.
Click here for the full report and neighborhood-by-neighborhood statistics!
CONDOS – SEATTLE & EASTSIDE
The 2025 Condo Report shows steady, encouraging activity across both the Seattle and Eastside condo markets. Year over year, condo sale prices increased a combined 2% to a median of $630,000, with homes selling for an average of $633/sq.ft. Half of all condos sold at or above their list price, signaling stable buyer demand. Inventory also expanded, with 8,331 new condo listings—up 14% from 2024! This is great news, increased supply that didn’t cause a price ‘dump’, it shows our Buyers may be returning to confidence around condos.
In Seattle, 2,695 condos sold during the year, a 9% increase in sales volume. The median Seattle condo price rose 2% to $585,000, and 51% of homes sold at or above list price. On the Eastside, 2,050 condos sold, with median prices increasing 5% year over year to $730,000. Eastside condos averaged $643 per square foot, with 51% selling at or above list price and 36% selling within the first 10 days. The market showed a combined 52 average days on market, with a 99% list to sales price ratio. Though, when original list to sales price ratio is compared the average sits at 97%. This means that patience and active calibration are both required when marketing your condo.
Mercer Island’s condo market also trucked along with 27 sales and a slight 1% year-over-year boost in median prices. Condos sold for an average of $591 per square foot, up 13% over 2024. Thirty-seven percent of condos sold at or above list price, and within the first 10 days. Inventory expanded as well, with 355 new condo listings, up 19% from 2024.
Check out area-by-area details in the full condo report.

WATERFRONT
Seattle saw a boost in the number of waterfront sales in 2025, with 36 compared to 31 in 2024. Lake Sammamish sales were similar to last year (31 vs. 30 in 2024), while Mercer Island and the Eastside both saw slight dips their sales numbers.
Mercer Island had the highest waterfront sale of the year at $25 million for a nearly 10,000 sq. ft. European Modern home on 102 feet of prime west-facing North End waterfront. The most modest sale was in Bellevue at $1.75 million for an original 1960s beach house on 50 feet of lakefront.
This brief overview of the entire Seattle-Eastside private waterfront market, including Mercer Island and Lake Sammamish, illustrates the trends occurring in our region over time. This data is interesting and insightful but cannot replace an in-depth waterfront analysis with your trusted professional.
View the full waterfront report


We earn the trust and loyalty of our brokers and clients by doing real estate exceptionally well. The leader in our market, we deliver client-focused service in an authentic, collaborative, and transparent manner and with the unmatched knowledge and expertise that comes from decades of experience.
© Copyright 2026, Windermere Real Estate/Mercer Island. Information and statistics derived from Northwest Multiple Listing Service and Trendgraphix, and deemed accurate but not guaranteed.
How’s the Market? Q2 2025 Review of Seattle Area Real Estate

The end of our spring market quieted down significantly as warm weather, graduations, and vacations distracted buyers and kicked off our typical summer slowdown. Despite this, Seattle posted modest year-over-year growth in both sales activity and median sales prices. The Eastside saw slight dips in sales prices and activity compared to last spring, but choice homes still sold quickly and most closed at or above their listed prices. Buyers found more room to negotiate, particularly on properties that needed work or otherwise didn’t generate immediate interest.
Our takeaways for Sellers: pricing strategy and early market momentum matter—homes that sell quickly are fetching the highest prices. Preparation and accurate positioning are key to success. For Buyers: There’s more inventory than last year, but the best homes are still moving fast and often over asking. Be ready to act decisively, especially in high-demand areas.
Click or scroll down to find your area report:
Seattle | Eastside | Mercer Island | Condos | Waterfront
SEATTLE
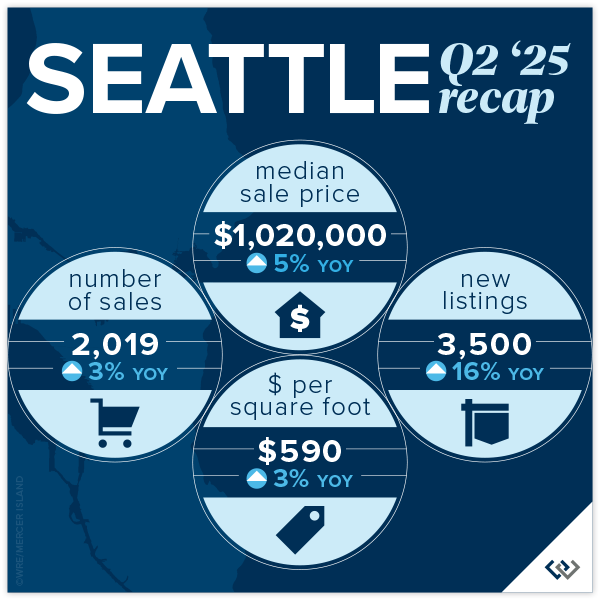
Seattle was a medal winner in the Q2 relay! Median sales price in Seattle hit $1.02M, up from $968K in Q2 2024—a 5% increase year-over-year, signaling a healthy and steadily appreciating market. Despite increased inventory, sales activity rose 3% YoY with 2,019 homes sold, reflecting stable demand. Homes that sold within the first 10 days received 105% of asking price, while those on market more than 30 days averaged just 97%, so speed continues to command premium pricing.
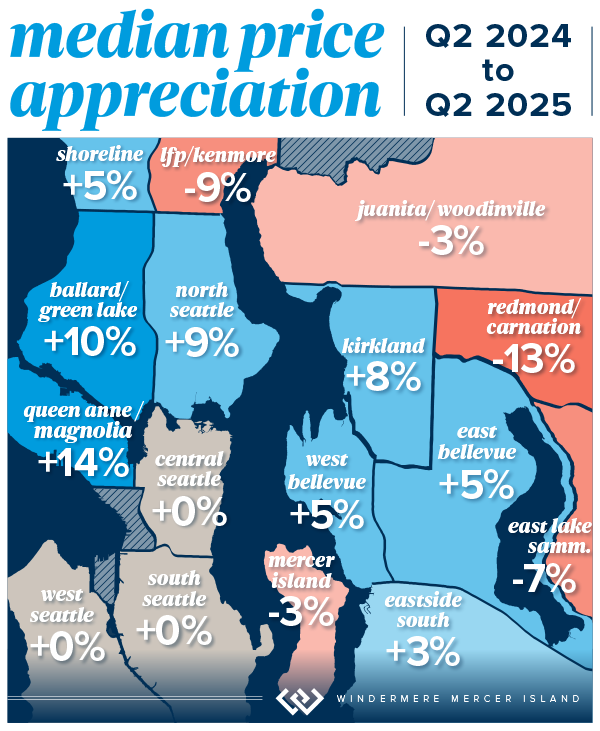
Momentum continues to be visible across several neighborhoods. Queen Anne & Magnolia led the city with a 14% price increase, pushing the median to $1.5m—a strong signal of those wanting quiet luxury near the downtown core. Ballard–Green Lake and North Seattle also saw notable gains, up 10% and 9% respectively. Central Seattle recorded a 6% increase in price per square foot and the highest number of units sold among central neighborhoods, showing a rebound in core urban demand. Lake Forest Park was the only area with a significant decline in median price (-9%) suggesting buyer opportunity in the near-north fringe.
Much like the Eastside, inventory jumped to 3,500 new listings in Q2, a 16% increase over Q2 2024, giving buyers more choices and slightly more negotiating room, especially for homes that linger on market.
The Seattle market in Q2 2025 showed measured growth, more listing activity, and resilient demand. Whether you’re buying or selling, strategy, timing, and clarity on your market segment are what will make the difference.
Click here for the full report and neighborhood-by-neighborhood statistics!
EASTSIDE
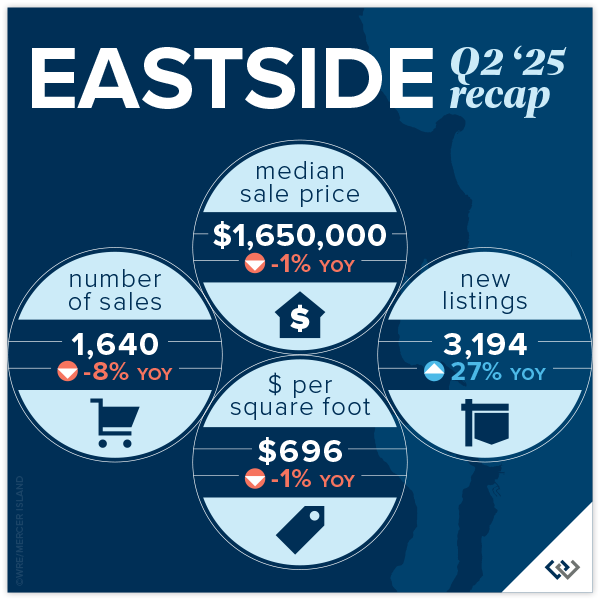
There was a listing surge this quarter and that was most significant on the Eastside! 3,194 homes were available—a substantial jump from just 2,509 in Q2 2024. This equates to a 27% increase in supply year-over-year. For buyers, there was more to choose from this quarter coupled with buyers being more selective and price sensitive. While competition is still strong, longer market times and slight price softening in some areas mean buyers have more negotiating power—especially in markets like Redmond and Sammamish.
But don’t rule out the homes priced and prepped well! Sales velocity remained strong, with 67% of homes selling at or above list price, and most (66%) selling within the first 10 days. 39% of homes even sold over asking price. The median sale price across the Eastside was $1.65M, slightly down from $1.67M last year (–1%), showing a stable but price-sensitive market. For those homes with a longer market time (over 30 days) on average, sellers took a 3% negotiation.
Areas like Sammamish (–7%) and Redmond (–13%) experienced the most significant price drops—indicating opportunities for buyers who are priced out of West Bellevue or Kirkland. If we’re talking community standouts, West Bellevue leads the pack in pricing, with a median sale price of $3.75M, up 5% year-over-year, and the highest price per square foot at $1,151. Kirkland saw the largest year-over-year price increase, up 8%, pushing the median to $2.19m. Redmond was the only major submarket to experience a notable increase in number of homes sold (+15%), despite a 13% price drop, suggesting high buyer demand for more affordable options.
Q2 2025 brought more listings and more choices, but the market remains fast-moving and price sensitive. Our takeaways for Sellers: pricing strategy and early market momentum matter—homes that sell quickly are fetching the highest prices. Preparation and accurate positioning are key to success. For Buyers: There’s more inventory than last year, but the best homes are still moving fast. If the home is listed, the seller is ready to make a deal. Whether you’re buying or selling, strategy, timing, and clarity on your market segment are what will make the difference.
Click here for the full report and neighborhood-by-neighborhood statistics!
MERCER ISLAND
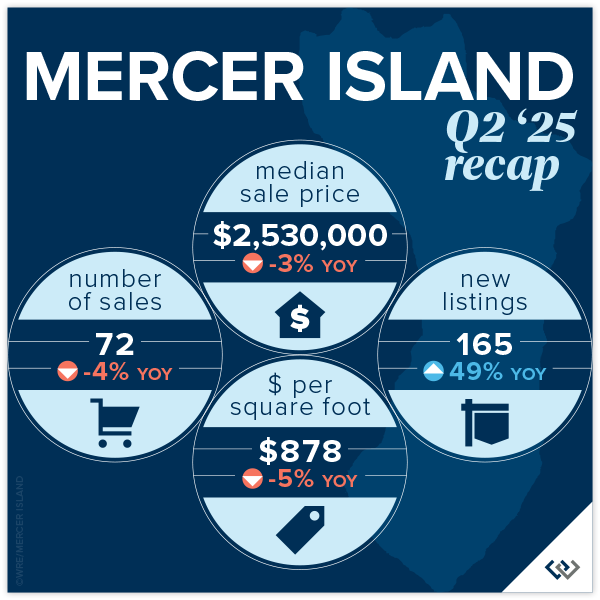
Mercer Island’s Q2 2025 market remains robust, especially for well-positioned single-family homes. As predicted, those homes that were prepped well and priced strategically found serious buyers quickly—many selling within the first 30 days. 64% of homes sold at or above their list price this quarter, a strong signal that sharp pricing and smart timing paid off.
What’s less visible in the headline numbers is that 38 of the homes listed in Q2 are still active today. This speaks to the importance of days on market as a key driver: homes that sold within the first 10 days (71% of sales) received 102% of asking price, while those on the market longer than 30 days fetched just 96%. A 4% negotiation window suggests buyers are discerning, and sellers may be responding to increased competition while planning for a typical summer slowdown.
With 72 residential sales, Q2 showed a healthy level of activity, but overall urgency softened, leading to downward pressure on pricing. The median sales price slipped to $2,530,000 from $2,937,000 in Q1, showing that the early-year momentum didn’t carry through Spring. Still, when compared to Q2 2024’s $2.5m, pricing has remained remarkably resilient.
Neighborhood standouts: the Westside led the market with strong price per square foot and intense buyer interest – 5 of the 6 homes sold within the first 10 days. The North End saw the highest sales volume with 14 homes sold, proving to be a consistent favorite. The South End offered 7 sales at a reasonable price per square foot of $722 vs. the North End’s $885 per foot.
While the data shows a seller-leaning market, buyer demand is unpredictable. With an uncertain Fall market ahead, sellers should prepare for longer market times, and bring patience along with their listing prep. Buyers, on the other hand, should know that opportunities exist across the island, especially in the condo sector, where activity is softer and pricing may be more approachable for those looking to establish a foothold on Mercer Island.
Click here for the full report and neighborhood-by-neighborhood statistics!
CONDOS – SEATTLE & EASTSIDE
Condos remained an accessible entry point for buyers across our region, with Q2 marking a strong showing. In Seattle, the most robust demand was found in more affordable neighborhoods like South and North Seattle—North Seattle alone saw a 24% jump in median price. Meanwhile, the luxury condo segment in Downtown Seattle moved more slowly, with average price per square foot landing at $794.
On the Eastside, the condo market felt uneven but held its value overall. While pricing trends varied by submarket, Eastside condos continued to outperform Seattle in overall price strength. Woodinville and Redmond stood out with impressive gains, while Mercer Island saw a softer quarter with just four sales and a median price dipping to $618K.
Sales activity rose 7% on the Eastside and 5% in Seattle compared to last year. Homes that sold within the first 10 days garnered the most attention, suggesting well-priced listings are still commanding strong interest. In Seattle, 53% of condos sold at or above list price; on the Eastside, that number climbed to 58%—a clear sign that buyers are negotiating in a competitive environment and pricing remains fluid.
With the single-family market still tight, condos—particularly those priced under $700K—continue to offer buyers a compelling path to homeownership in desirable neighborhoods.
Check out area-by-area details in the full condo report.
WATERFRONT
Lake Sammamish and Eastside waterfront saw a busy Q2 with 13 and 9 sales respectively. After a big Q1, Seattle waterfront sales slowed in Q2 with just 4 sales (as opposed to 10 last quarter). Mirroring the overall market, waterfront saw some softening on price—the vast majority of homes sold at or below their list prices with just a few choice properties attracting bidding wars.
Yarrow Point garnered the largest sale price of $13 million for an immense Cape Cod inspired estate encompassing over half an acre, 7,465 sq. ft. of interior living spaces, and 82 feet of prime low- to no-bank waterfront. Lake Sammamish offered the best bargain—an original 1975 lake house on 1/3 acre with 50 feet of waterfront that was snagged for $2.6 million.
This brief overview of the entire Seattle-Eastside private waterfront market, including Mercer Island and Lake Sammamish, illustrates the trends occurring in our region over time. This data is interesting and insightful but cannot replace an in-depth waterfront analysis with your trusted professional.
View the full waterfront report
We earn the trust and loyalty of our brokers and clients by doing real estate exceptionally well. The leader in our market, we deliver client-focused service in an authentic, collaborative, and transparent manner and with the unmatched knowledge and expertise that comes from decades of experience.
© Copyright 2025, Windermere Real Estate/Mercer Island. Information and statistics derived from Northwest Multiple Listing Service and Trendgraphix, and deemed accurate but not guaranteed. Seattle cover photo courtesy of Codi Nelson, by HD Estates Photography. Eastside cover photo courtesy of Fred Fox & Julie Wilson by Bobby Erdt, Clarity Northwest Photography. Mercer Island cover photo courtesy of Janet Bell & Julie Wilson, by Bobby Erdt, Clarity Northwest Photography. Condo cover photo courtesy of Luke Bartlett, by Kealin Branson, Clarity Northwest Photography. Waterfront cover photo courtesy of Nancy LaVallee, by Amaryllis Lockhart, Clarity Northwest Photography.
2025 Seattle & Eastside Farmers Markets

Summer is just around the corner, and so are these farmers markets! Spend an evening or weekend finding your new favorites among the tents. Think it’s all about kale? Think again. Most offer live entertainment along with a mouth-watering variety of local brews, cheese, bread, meat/seafood, honey, hand roasted coffee, and other hidden gems (in addition to the freshly picked fruits & veggies).
Seattle Metro
- Ballard
- Capitol Hill (Broadway)
- Columbia City
- First Hill
- Fremont
- Lake City
- Lake Forest Park
- Madrona
- Magnolia
- Phinney
- Pike Place
- Queen Anne
- Shoreline
- South Lake Union – Farmers Market
- South Lake Union – Saturday Market
- U-District
- Wallingford
- West Seattle
Greater Eastside
- Bellevue – Crossroads
- Bellevue – Downtown
- Carnation
- Duvall
- Issaquah
- Kirkland – Downtown
- Kirkland – Juanita
- Mercer Island
- North Bend
- Redmond
- Renton
- Sammamish
- Woodinville

Seattle Metro
Ballard
Seattle’s first year-round Farmers Market, selling produce exclusively from Washington state farmers along the historic cobblestone stretch of Ballard Ave.
Sundays, 9am – 2pm | Year-Round
5345 Ballard Ave NW | Seattle
sfmamarkets.com/visit-ballard-farmers-market/
Capitol Hill (Broadway)
Come for Sunday brunch from food vendors who source ingredients from local, WA state farms (many of whom you’ll also meet selling their wares at the market). Live music and street performers often make an appearance, too.
Sundays, 11am – 3pm | Year-Round
Tuesdays, 3pm – 7pm (June 3 – September 30, 2025)
E Barbara Bailey Way | Seattle
seattlefarmersmarkets.org/chfm
Columbia City
With everything from freshly harvested Asian greens to Ethiopian eats, come check out the immense variety King County’s most diverse zip code has to offer. Bring your bounty to adjacent Columbia Park for a picnic.
Wednesdays, 3pm – 7pm | May 7 – Oct 15, 2025
37th Ave S & S Edmunds St | Seattle
seattlefarmersmarkets.org/ccfm
First Hill
A Pike Place Satellite Market, this small “express market” offers locally sourced veggies, fruits, flowers, honey, jam, and organic meats from the region’s finest farms.
Fridays, 10am – 2pm | June 20 – Sept 26, 2025
9th Avenue & University Street | Seattle
pikeplacemarket.org/market-programs-events/farmers-markets
Fremont
With a newly expanded Promenade encompassing two blocks along the Fremont Canal, you can find just about everything at this “hyper market”—an eclectic mix of a farmer’s market, flea market and artists’ alley. The food is pretty epic, too!
Sundays, 10am – 4pm | Year-Round
3401 Evanston Ave N | Seattle
fremontmarket.com
Lake City
This celebrated North End seasonal market offers unique finds grown and prepared by local farms and food artisans. Enjoy kids’ activities, too!
Thursdays, 3pm – 7pm | June 12 – Oct 2, 2025
NE 125th St & 28th Ave NE | Seattle
seattlefarmersmarkets.org/lcfm
Lake Forest Park
With an emphasis on fresh, locally grown food, this market is an epicurean’s delight. Browse hard cider, baked goods, preserves, meat, pasta, sauces, and prepared foods along with the locally harvested fruits and veggies. There is also one “Crafts Market” each summer featuring local artisans.
Sundays, 10am – 2pm | May 11 – Oct 19, 2025
17171 Bothell Way NE | Lake Forest Park
www.thirdplacecommons.org/farmers-market
Madrona
Located in one of Seattle’s most diverse neighborhoods, you’ll find artisan foods as well as seasonal produce from Washington state farmers, fishers, and ranchers.
Fridays, 3pm – 7pm | May 16 – Oct 31, 2025
MLK Way & E Union St | Seattle
sfmamarkets.com/madrona-farmers-market
Magnolia
This popular Saturday market is nestled in the tree-lined Magnolia Village. In addition to seasonal fruits and veggies, you’ll find sweet & savory pies, fresh bread, flowers, and more!
Saturdays, 10am – 2pm | June 7 – Oct 11, 2025
W McGraw St & 33rd Ave W | Seattle
seattlefarmersmarkets.org/mfm
Phinney
A popular gathering spot for both the Phinney Ridge and Greenwood communities, this market is right next door to a playground and offers live music in addition to the great mix of fresh produce and prepared food.
Fridays, 3pm – 7pm | June 6 – Sept 26, 2025
6532 Phinney Ave N | Seattle
seattlefarmersmarkets.org/pfm
Pike Place
No introduction needed…make it a day with great restaurants, eateries and retail shops, too.
Daily, 9am – 6pm (farm tables close at 4pm) | Year-Round (Closed Thanksgiving & Christmas)
Pike Place between Pine & Virginia St | Seattle
(206) 682-7453
pikeplacemarket.org
Queen Anne
Seattle’s only independent farmers market, offering food, chef demos, live music, and children’s activities.
Thursdays, 3pm – 7:30pm | May 29 – Oct 9, 2025
Spring Preview Market on May 10, 2025, 10am-3pm
Harvest Markets on Oct. 25 & Nov. 22, 10am-3pm
Queen Anne Ave N & W Crockett St | Seattle
qafm.org
Shoreline
Now located at the BikeLink Park & Ride (corner of 192nd & Aurora, across from Sky Nursery), this market offers kids’ programs and live music in addition to its fresh Washington produce, organic meats, bread, honey, and prepared foods.
Saturdays, 10am – 2pm | June 7 – Oct 25, 2025
18821 Aurora Ave N | Shoreline
shorelinefarmersmarket.org
South Lake Union – Farmers Market
Affiliated with Pike Place Market, this small satellite market offers locally sourced veggies, fruits, flowers, honey, jam, and organic meats from the region’s finest farms.
Thursdays, 10am – 2pm | June 26 – Sept 25, 2025
426 Terry Avenue N | Seattle
pikeplacemarket.org/market-programs-events/farmers-markets/
South Lake Union – Saturday Market
Note the new location for 2025 on 6th Ave, next to The Spheres. More of a makers market along with vintage boutiques and food trucks…you won’t find traditional produce booths, but you will find brunch and plenty of retail therapy.
Saturdays, 11am – 4pm | June 7 – Sept 27, 2025
6th Ave & Lenora St | Seattle
slumarket.com
University District
Come visit Seattle’s largest and oldest farm/food only market, recognized as one of the best farmers markets in the U.S.! With over 80 booths and hard-to-find ingredients, it’s a chef’s delight.
Saturdays, 9am – 2pm | Year-Round
University Way NE (the “Ave”) between 50th & 52nd | Seattle
seattlefarmersmarkets.org/udfm
Wallingford
Located in Meridian Park, you can shop with the whole fam and then enjoy a picnic or playtime at the award-winning playground.
Wednesdays, 3pm – 7pm | May 28 – Sept 24, 2025
4800 Meridian Ave N | Seattle
sfmamarkets.com/visit-wallingford-farmers-market/
West Seattle
A weekend destination for families across the area, this market is set in the vibrant West Seattle Junction and features up to 70 vendors during the summertime peak. Great community atmosphere celebrating Washington grown food and ingredients.
Sundays, 10am – 2pm | Year-Round
California Ave SW & SW Alaska | Seattle
seattlefarmersmarkets.org/wsfm
Greater Eastside
Bellevue – Crossroads
East Bellevue’s market features fruits, veggies & dairy products from Washington state farms along with hand crafted bird houses, candles, dog accessories, herbal wellness products, and more. Don’t miss the tacos, Nepalese street food, and handmade ice cream sandwiches, too!
Tuesdays, 12pm – 6pm | June 3 – Sept 30, 2025
15600 NE 8th St | Bellevue
https://crossroadsbellevue.com/music-events/crossroads-farmers-market/
Bellevue – Downtown
Set in the heart of Downtown Bellevue, this market offers goods exclusively produced within Washington state—from seasonal fruits & veggies to flowers, fresh meats, artisan goods, and prepared cuisine. The Power of Produce (POP) club empowers kids to know where their food comes from and make healthy eating choices.
Thursdays, 3pm – 7:30pm | May 22 – Oct 2, 2025
(Closes at 7pm after Labor Day)
1717 Bellevue Way NE | Bellevue
bellevuefarmersmarket.org
Carnation
Set in the heart of the Sno-Valley farming district, you’ll find plenty of freshly picked produce along with live music and educational activities for the kids.
Tuesdays, 3pm – 7pm | June, July & August 2025
Tolt-MacDonald Park, 31020 NE 40th St | Carnation
carnationfarmersmarket.org
Duvall
Nestled alongside the scenic Snoqualmie River, this friendly market features local eggs, jams, fresh roasted coffee, arts, crafts, and baked goods in addition to the seasonal veggies, fruits, and plant starts. Live music, picnic shelters and a playground make this a fun family destination.
Thursdays, 3pm – 7pm | May 1 – October 9, 2025
(Closes at Sunset in October)
Taylor Landing at 16201 Main St NE | Duvall
Parking Map
duvallfarmersmarket.org
Issaquah
Located at the historic Pickering Barn, this picturesque venue offers a variety of fresh farm and food-based products, concessions, and local artisans.
Saturdays, 9am – 2pm | May 10 – Sept 27, 2025
Pickering Barn, 1730 10th Ave NW | Issaquah
Market Map
www.issaquahwa.gov/778/Farmers-Market
Kirkland – Downtown
This stunning setting on the Lake Washington shoreline turns shopping into a day at the beach. Peruse local produce and goods, then go for a swim or stroll along Moss Bay. Perfect for a picnic, too!
Wednesdays, 3pm – 7pm | June 4 – September 24, 2025
Marina Park, 25 Lakeshore Plaza | Kirkland
kirklandmarket.org
Kirkland – Juanita
Set in beautiful Juanita Beach Park on Lake Washington, you’ll find as many as 30 vendors offering farm fresh local produce, herbs, honey, nuts, flowers, plants, baked good, handcrafted items, and prepared cuisine. Make it a date with live music and a picnic at the beach. There’s a great playground for the kids, too.
Fridays, 3pm – 7pm | June 6 – Sept 26, 2025
Juanita Beach Park, 9703 NE Juanita Dr | Kirkland
www.kirklandwa.gov
Mercer Island
Come on down for quality local Washington state produce, cheese, fish, meat, bread, and more. Check out the live music schedule, too!
Sundays, 10am – 2pm | June 1 – Sept 28, 2025
Farmers Only Pop-Up Market: Oct 12, 2025
Harvest Market: Nov 23, 2025
Mercerdale Park, 7700 SE 32nd St | Mercer Island
www.mifarmersmarket.org
North Bend
This relaxed market enjoys live music and a spectacular Mount Si view. Vendors offer fresh produce, berries, honey, flowers, baked goods, hand-crafted items, and delicious prepared foods. Kids can participate in the Power of Produce (PoP) Club. Two playgrounds plus play fields and a covered picnic shelter make this a fun hangout spot. Leashed pets are welcome, too!
June 5 – August 21, 2025: Thursdays, 4pm – 8pm (Closed 6/19 for Juneteenth)
August 28 – September 11, 2025: Thursdays, 3:30pm – 7:30pm
Si View Park, 400 SE Orchard Dr | North Bend
www.siviewpark.org/farmers-market.phtml
Redmond
Going strong since 1976, the Redmond Saturday Market offers a huge selection of vendors and dazzling array of produce, flowers, cheeses, preserves, salmon, tea, and handmade goods such as pottery and soaps. You’ll love the ready-to-eat foods, too.
Saturdays, 9am – 2pm | May 3 – Oct 25, 2025 (Closed May 10th)
9900 Willows Rd NE | Redmond
www.redmondsaturdaymarket.org
Renton
Find exclusively Washington-produced fruits, veggies, handmade goods, arts, crafts and more right in the heart of downtown Renton. Food trucks, live music, and kids’ activities make this a fun spot to liven up your Tuesday. Note: for 2025, the market has moved a couple of blocks to Williams Ave S while Piazza Park is being refurbished.
Tuesdays, 3pm – 7pm | June 3 – Sept 30, 2025
Willliams Ave S (Between S 2nd & S 3rd Streets) | Renton
www.rentonfarmersmarket.com
Sammamish
Each Wednesday, the Sammamish Commons plays host to a variety of local farmers, nurseries, bakeries, artisans, food vendors, and more. Live music and kids’ activities, too!
Wednesdays, 4pm – 8pm | May 7 – Sept 17, 2025
Sammamish Commons, 801 228 Ave SE | Sammamish
Parking: Mary, Queen of Peace Catholic Church, 1121 228th Ave SE
www.sammamishfarmersmarket.org
Woodinville
Come check out downtown Woodinville’s Schoolhouse District and find produce grown in the state of Washington (and picked fresh for that morning!). You’ll also have an array of boutique baked goods, sauces, cider, artisans, and more to peruse.
Saturdays, 10am – 2pm | May 3 – Sept 27, 2025
13205 NE 175th St | Woodinville
woodinvillefarmersmarket.com
We earn the trust and loyalty of our brokers and clients by doing real estate exceptionally well. The leader in our market, we deliver client-focused service in an authentic, collaborative, and transparent manner and with the unmatched knowledge and expertise that comes from decades of experience.
© Copyright 2025, Windermere Real Estate/Mercer Island.
How’s the Market? Q1 2025 Review of Seattle Area Real Estate

Q1 started the year off strong for Seattle-area real estate with the majority of homes selling in the first 10 days on the market and for at or above their listed prices. Median sales prices were also up compared to Q1 of last year. Buyers enjoyed more choice with new listings outpacing sales, steadily increasing our supply of available homes for sale.
What the numbers don’t show yet is that the spring market sprang early, in January and February; now that prime inventory is hitting the market, demand appears to be waning. Our advice to Home Shoppers: don’t take any chances. Just because the last new listing didn’t sell in a competitive situation, doesn’t mean the next one won’t. If you love the home, act with confidence. Our advice to Home Sellers: don’t take any chances. Prep well, price appropriately, and take that first buyer seriously. It’s unpredictable out there.
Click or scroll down to find your area report:
Seattle | Eastside | Mercer Island | Condos | Waterfront
SEATTLE
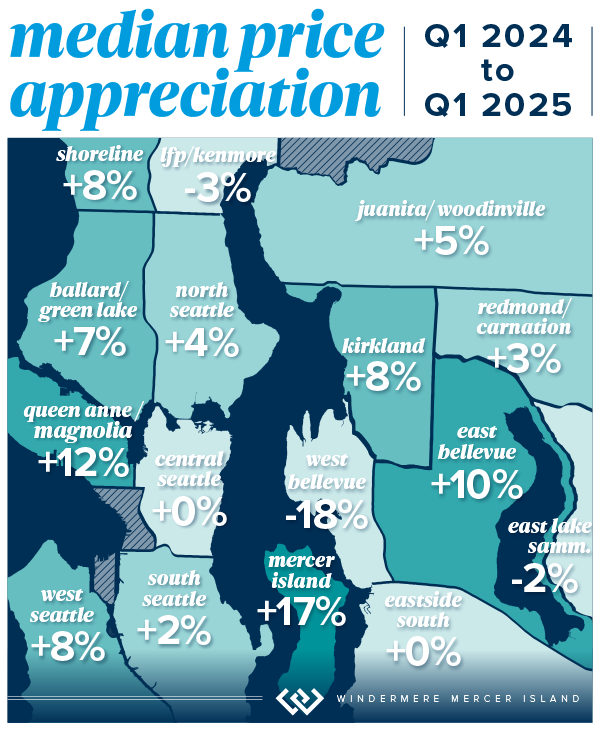
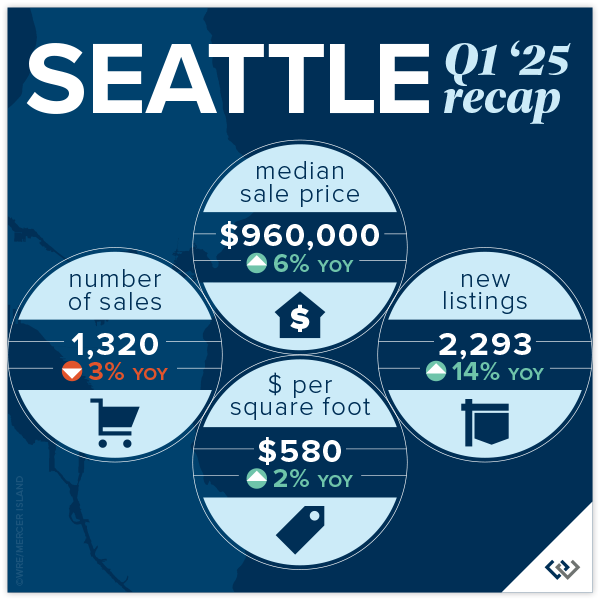
The Seattle real estate market continues to show encouraging signs of strength and stability as we step into 2025. Median home prices rose 6% year-over-year to $960,000, building on the 9% increase we saw in Q1 2024 and rebounding from $830,000 in Q1 2023. That’s a remarkable $130,000 gain in just two years. Inventory is also trending in the right direction, with 2,293 new listings this quarter—up 14% from Q1 2024 and significantly higher than the 1,958 new listings in Q1 2023. It appears that need is outweighing the pull of a sub 3% interest rate when considering whether or not to make a move.
Momentum is visible across several neighborhoods. West Seattle, for instance, saw 75% of homes sell at or above list price (up from 71% last year and 70% the year before), while North Seattle maintained its reputation for competitive sales—70% sold at or above list and 66% sold in the first 10 days. Madison Park & Capitol Hill remained a strong performer with an impressive median price of $1,100,000; holding steady year-over-year after a 10% jump last year.
Citywide, 71% of homes sold at or above list price—up from 69% in Q1 2024—and the average price per square foot increased to $580, up 2% from last year. Quick market movement also continues to be a theme, with 62% of homes going pending in the first 10 days.
Click here for the full report and neighborhood-by-neighborhood statistics!

EASTSIDE
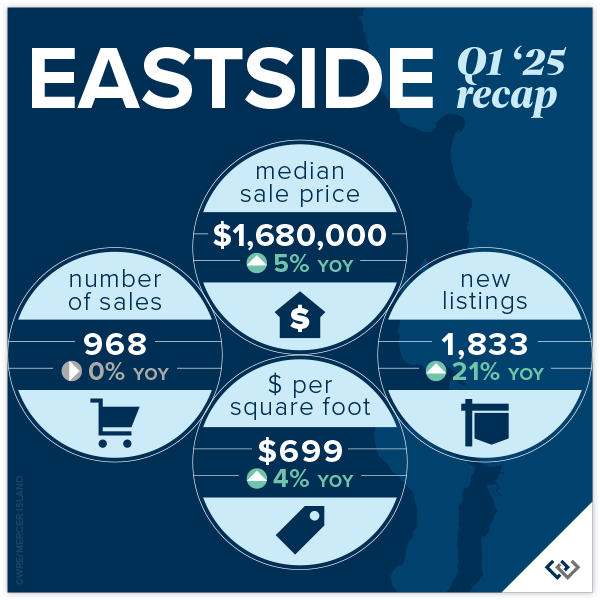
The Eastside market continues its upward momentum, with a 5% year-over-year increase in median sale price to $1,680,000 in Q1—building on the 14% jump reported in Q1 2024 and the remarkable recovery from Q1 2023’s $1,400,000 low. This marks a $280,000 increase over two years, a clear signal of sustained buyer demand and market strength.
Homes are moving quickly, with 69% selling in the first 10 days—up from 65% last year. Additionally, 72% of homes sold at or above list price, improving consistently from 68% in 2024. East Bellevue (E of 405) stood out with 83% of homes selling in the first 10 days and a 10% jump in median price—continuing its leadership in market competitiveness in recent years.
We also saw notable activity in Redmond, where sales rose 10% and 75% of homes sold in the first 10 days. Kirkland held strong as well, with an 8% increase in median price to $2.21M after last year’s 32% gain. And despite West Bellevue’s sharp 18% price dip, it remains one of the most valuable submarkets with a median price of $3,200,000.
The listing count jumped 21% year-over-year, with 1,833 homes hitting the market—finally turning a corner after multiple years of historically low inventory. Overall average price per square foot also increased 4% to $699.
Click here for the full report and neighborhood-by-neighborhood statistics!
MERCER ISLAND
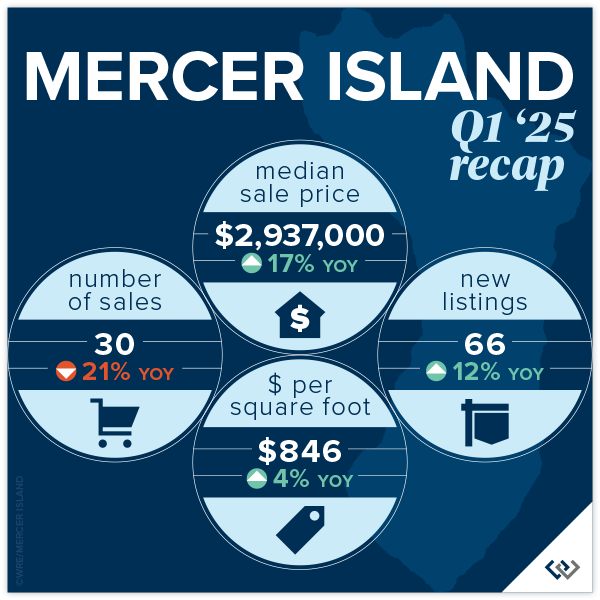
Mercer Island’s real estate market launched into 2025 with remarkable momentum. Median sale prices surged 17% year-over-year to $2,937,000—outpacing both Q1 2024’s 13% growth and 2024’s full-year 11% rise. This continued appreciation reflects strong buyer demand and an increase in high-value transactions across neighborhoods like Southend and Northend, which posted some of the highest median sales at $4,401,000 and $4,012,000 respectively.
While total sales volume declined by 21% from Q1 2024, due in part to seasonally low inventory, the market remained highly competitive. Over half (53%) of homes sold within the first 10 days—down from 73% in Q1 2024 but still a strong indicator of buyer urgency. Likewise, 47% of homes sold at or above list price, a notable drop from last year’s 65%, but consistent with Q1’s evolving pace as buyers exercise more discretion amid shifting macro conditions.
Inventory began to bounce back with 66 new listings—12% more than Q1 2024—signaling renewed confidence from sellers. Price per square foot rose modestly by 4% to $846, continuing the stable value trend seen in prior quarters.
 Click here for the full report and neighborhood-by-neighborhood statistics!
CONDOS – SEATTLE & EASTSIDE
The condo market is off to a strong and balanced start in 2025. With a 15% year-over-year increase in Seattle’s median condo price—now at $635,000—and a 9% increase on the Eastside to $735,000, it’s clear that confidence is returning to this sector. Seattle posted a 19% rise in condo sales, while Eastside transactions grew 15%, building on the momentum established last year. Go Seattle Go! We’re always rooting for downtown condo recovery.
Woodinville condos were the breakout stars this quarter, with a remarkable 108% rise in median sale price and 41% more units sold. Likely due to new construction projects in wine country. Redmond followed suit, reporting a 27% price jump and 36% growth in volume. Meanwhile, West Bellevue remains the most expensive submarket at $1,045,000, despite some pricing fluctuations. Seattle’s North End also had a strong showing, with prices up 3% and more than half of condos selling at or above list price.
In terms of competitiveness, Mercer Island stood out with 80% of its (5) sales happening in the first 10 days—up from 52% last year. This level of demand echoes across the Eastside, where 44% of homes sold within 10 days, up from 39% last year. Seattle mirrored this pace with 35% selling in the first 10 days.
Inventory has expanded as well. New condo listings rose 34% over last year, providing buyers with more choice while keeping upward pressure on prices. The condo market is proving to be as unpredictable as all things in the US today. There are certainly bright spots and it we are cautiously optimistic that Home Shoppers are considering condos a realistic option, unlike years past.
Check out area-by-area details the full condo report.
WATERFRONT
Seattle led the pack with 10 waterfront sales in Q1 of 2025, including the highest sale in the region—an immense 15,321 square foot Magnolia home on over 3 acres and 293 feet of waterfront that sold for $21,500,000. All but 3 of Seattle’s waterfront homes sold within the first 10 days on the market with one Lake Forest Park home going for $160,000 above the asking price.
The Eastside also posted some impressive Q1 sales, including a $16m Hunts Point sanctuary and a $13.125m Italian-inspired stunner at Mercer Island’s southern tip. The most modest waterfront sale was an original 1968 beach house on 58 feet of lakefront in Bellevue that sold for $1,750,000.
This brief overview of the entire Seattle-Eastside private waterfront market, including Mercer Island and Lake Sammamish, illustrates the trends occurring in our region over time. This data is interesting and insightful but cannot replace an in-depth waterfront analysis with your trusted professional.
We earn the trust and loyalty of our brokers and clients by doing real estate exceptionally well. The leader in our market, we deliver client-focused service in an authentic, collaborative, and transparent manner and with the unmatched knowledge and expertise that comes from decades of experience.
© Copyright 2025, Windermere Real Estate/Mercer Island. Information and statistics derived from Northwest Multiple Listing Service and Trendgraphix, and deemed accurate but not guaranteed. Seattle cover photo courtesy of Brooke Davis and Northwest’s Best Real Estate Video & Photography. Eastside cover photo courtesy of Joe C. Liu and Clarity Northwest Photography. Condo cover photo courtesy of Andrea Iverson and Andrew Webb, Clarity Northwest Photography.
How’s the Market? Annual Real Estate Review for the Seattle Area

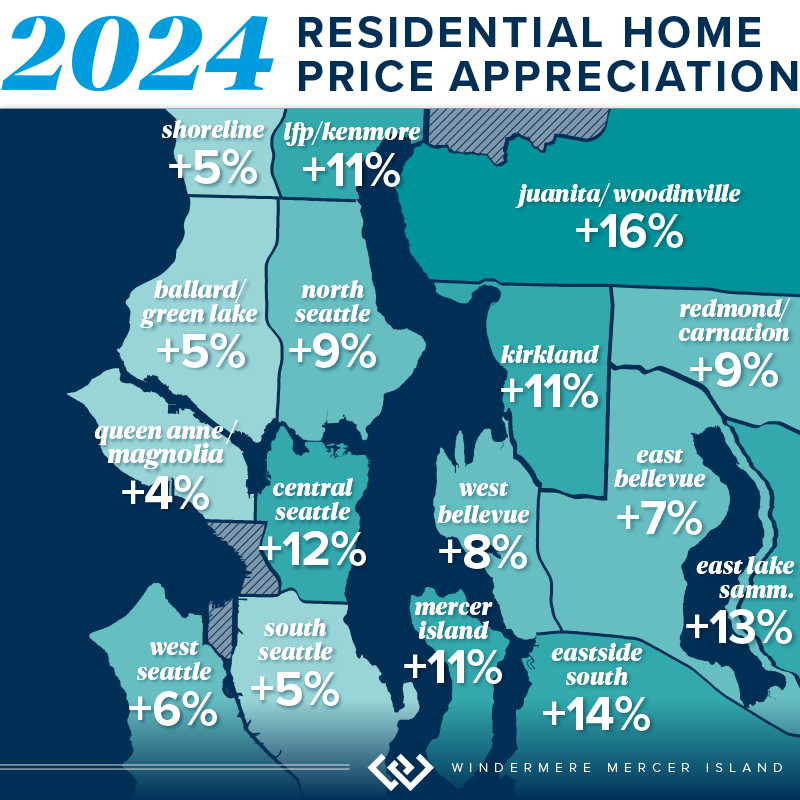
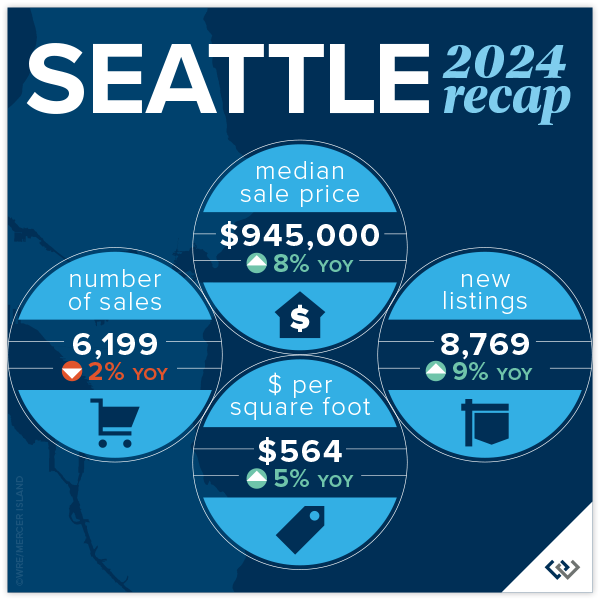
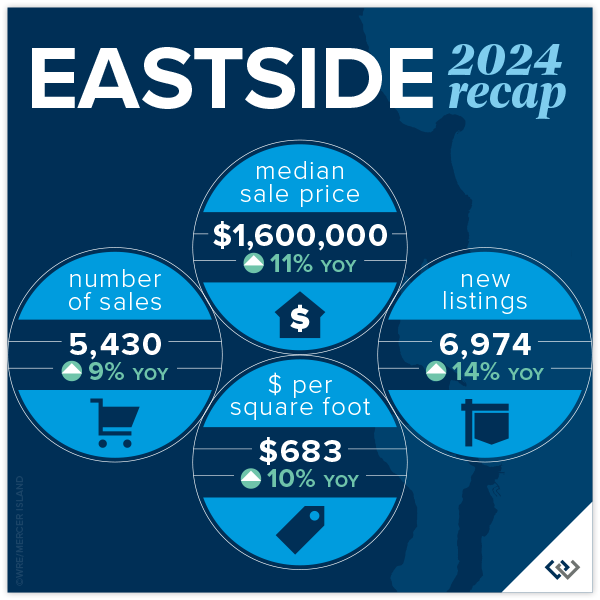
Happy New Year! Whew, we made it! With 2024 now in the books, we’re looking back fondly on a real estate market that showed positive signs of growth in virtually every sector. Median sales prices posted strong double-digit gains on the Eastside along with a healthy 8% rise in Seattle. Listings also rose, easing the strain for buyers grappling with our housing shortage.
If you’ve waited long enough and 2025 is the year for you to make a move, we recommend front loading that decision. Pent up demand (both sellers waiting to sell and buyers waiting to buy) should give us a spring full of blossoming and beautiful inventory. There is less volatility in interest rates than there has been in recent months, you’ll see that the average rate has been rock steady around 6.75% in 2023 and 2024. Overall, this is a great time to buy or sell and I am excited to help you!
Click or scroll down to find your area report:
Seattle | Eastside | Mercer Island | Condos | Waterfront
SEATTLE
From a statistical/real estate perspective, the numbers don’t really reflect the overall vibe of the year. In a good way! It’s all positive news: prices are up, listings are up, and market time is down. The City of Seattle is in full recovery mode. Homeowners are awaiting the new density plan and eager to learn what the city has in store for the core neighborhoods around transit. It’s an exciting time. Median sold price city-wide reached a record $945,000 (modest, as that is $5000 above the previous record set in 2022) and homes sold for an average 104% of list price when they attracted a sale in the first 10 days (58% of the total sales).
Lake Forest Park and Madison Park saw the greatest price gains at 11% and 12% respectively. North Seattle was over all the “strongest” with 66% of homes selling in the first 10 days and 70% of homes selling for at or above list price. There was a modest gain in new listings across the board at 8769, while still lower than typical. The ten-year average is around 10,500 listings per year. No bad news here with average price per square foot gains of 5% to $564!
 Click here for the full report and neighborhood-by-neighborhood statistics!

EASTSIDE
Welcome 2025! We (the real estate community) are feeling hopeful and bullish about what’s to come. So far, the numbers year over year support that. When we reviewed 2023 for the Eastside, the only positive statistic reported was Mercer Island’s 2% rise in the number of home sales. Looking at the 2024 report with that perspective it is ALL good news. New listings are up 14% for the year, while the number of sales are up nearly 10%. This is absorption of inventory to be excited about. Prices are up 11% to a record high of $1,600,000!
Woodinville and the area S of I-90 saw the largest price gains at 16% and 14% respectively, likely enjoying the benefits of buyers ‘pushing out’ because of the pressure of affordability in the core neighborhoods. Kirkland and West Bellevue were among the highest total sales and still a strong showing in price gains at 11% and 8%. Even though Bellevue (E of 405) saw the most modest price gains this was arguably the most popular neighborhood with 74% of homes selling in the first 10 days and 71% selling for at or above asking price!
 Click here for the full report and neighborhood-by-neighborhood statistics!
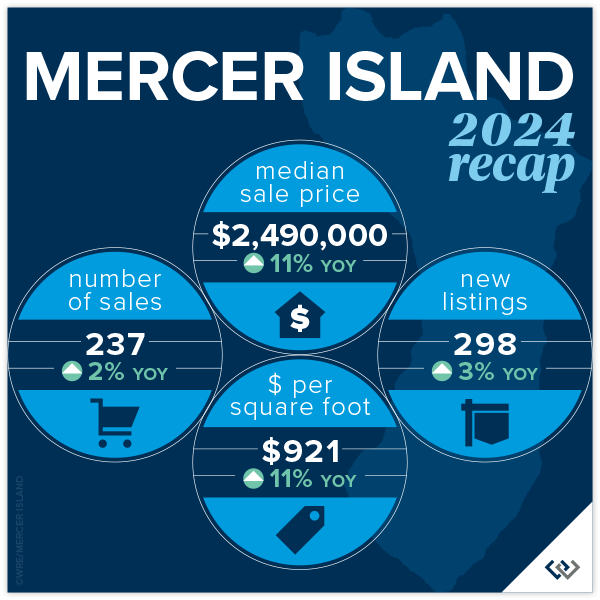
MERCER ISLAND
2024 was a solid year for Mercer Island: 11% overall price growth, on average 98% list to sales price ratio, and a respectable 32 cumulative days on market. This was a year of calm and confident decisions made by the entire real estate market. Home buyers and sellers alike. Looking to the neighborhoods there were two that stood out in relation to 2023: The Eastside and The Lakes where total sales had massive growth. 26 homeowners (vs 11 in 2023) moved on the Eastside and in the Lakes there were 4 transactions, a whopping change given that there were no sales reported on the MLS in 2023. The Island has not yet reached the peak prices from 2022, but we’re on our way!
Shifting to the condo market, 2024 was a sleepy year. With 47 new listings and 33 sales (both about 20% lower than in 2023), the average list to sales price ratio of 101% surprised us! Total median price is down YOY by about 8%, but with such little data to draw from this number tends to swing more than most. The overall price swing was from $339,000 for a studio to $1,775,000 for a 2 bedroom luxury unit. 19 of the 33 sales were 2 bedroom units. All in all condos on the island are a necessary market segment that we continue to watch closely as an overall indicator of market health.
 Click here for the full report and neighborhood-by-neighborhood statistics!
CONDOS – SEATTLE & EASTSIDE
In reviewing last years’ report, there was so much RED! This year is a refreshing change with some positive numbers sprinkled in. Even the pockets that remain flat feel like good news, after all, a push is a win! Perspective is everything, in life and in real estate. This year was absolutely a bright spot for condos in the last several months. This was due in large part to external factors: affordability issues in single family, perceived ‘high’ interest rates, continued density issues in the ‘burbs, and major employers recall to office. Urban life in both Seattle and on the Eastside are experiencing a renaissance and we’re here for it!
The headline in Seattle is that prices are UP! Downtown saw an increase of 8% to a median price of $650,000. Though, North Seattle carried the day with an eye popping 18% increase in median price. While price per square foot was flat on average, new listings are up 21% YOY. Sellers are dipping their toes back in the market at higher prices (up 5.3%) and seeing moderate success with total sales down 3% (compared to a 26% drop in 2023). Buyers know they have options and will wait to pick off the low hanging fruit: best perceived value for their dollar.
Meanwhile, on the Eastside: prices are up, listings are up, sales are up. A nice headline, but let’s break it down. New listings rose a whopping 34% year over year (which you may remember saw a 23% dip from 2022). Demand was steady with total sales up 15% YOY; we didn’t quite absorb all of the new inventory but that is to be expected. So, even with a relatively high absorption rate prices rose to a record high median of $695,000. The stars of this price gain are, not surprisingly, Kirkland and West Bellevue at 28% and 24% respectively. We can’t wait to see what 2025 will bring!
Check out area-by-area details the full condo report.
WATERFRONT
The Eastside saw a huge boost in waterfront sales with 50% more sold in 2024 than 2023. Mercer Island and Lake Sammamish posted similar sales gains of 45% and 43% respectively. While Seattle had 2 fewer sales than the year prior, its waterfront homes sold faster than in any other area and fetched higher selling prices as compared to list prices.
The highest waterfront sale was $38,900,000 for an immense 13,590 sq. ft. Medina estate on 117 feet of Lake Washington shoreline. The most modest sale was $1,400,000 for a 1960 Ralph Anderson original on Seattle’s Arroyo Beach.
This brief overview of the entire Seattle-Eastside private waterfront market, including Mercer Island and Lake Sammamish, illustrates the trends occurring in our region over time. This data is interesting and insightful but cannot replace an in-depth waterfront analysis with your trusted professional.
We earn the trust and loyalty of our brokers and clients by doing real estate exceptionally well. The leader in our market, we deliver client-focused service in an authentic, collaborative, and transparent manner and with the unmatched knowledge and expertise that comes from decades of experience.
© Copyright 2025, Windermere Real Estate/Mercer Island. Information and statistics derived from Northwest Multiple Listing Service and Trendgraphix, and deemed accurate but not guaranteed. Seattle cover photo courtesy of Michael Fleming and Clarity Northwest Photography. Mercer Island cover photo courtesy of The Sirianni Group and Clarity Northwest Photography. Condo cover photo courtesy of Luke Bartlett and Matthew Gallant, Clarity Northwest Photography.
How’s the Market? Q3 2024 Review of Seattle Area Real Estate

While Q3’s summertime market slowed a bit from the frenetic spring pace of Q2 (we call this the “Summer Slump”), median home values are up across the region compared to this time last year. Most homes still sold at or above their listed prices in the first 10 days on market. However, buyers had more choice with higher inventory levels AND some room to negotiate on price for those homes that stayed on the market past the 10-day mark.
What does this mean for the rest of 2024? We typically see buyer activity decrease as we head into the holidays, and of course, it’s also election season. If you’ve been considering a purchase and are of the mindset that you don’t want to compete, THIS IS YOUR MARKET! For sellers the average days on market in Q3 was 20 for Seattle and 18 for the Eastside. Which means: if your price didn’t attract a buyer in the first two weeks, it’s probably time to re-evaluate. Interest rates are better than they’ve been since mid 2022. Quality inventory is being presented to the market. If you see a great house, be prepared to move quickly. Opportunity Knocks.
Click or scroll down to find your area report:
Seattle | Eastside | Mercer Island | Condos | Waterfront
SEATTLE
Lots of good news in Seattle during our post-summer glow. Prices are up year over year by 5% to $937,000. While we’re still under the peak median of $1,000,000 set in Q2 of 2022 and $970,000 from last quarter, this is so typical for Q3. We’ve seen it every year from Q2 to Q3 going back to 2018 (except in 2020 largely because the real estate market shut down completely in Q2). Buyers had lots of choice, with more inventory to end the quarter than we’ve had since Q3 of 2022. Even with these buyer bright spots we still saw 56% of homes sell in the first 10 days and 34% over the asking price.
Average price per square foot and median price were in positive territory across the board this quarter in all neighborhoods. Richmond Beach/Shoreline and Madison Park/Capitol Hill both saw larger than typical gains in $/sq.ft. (11%) and median price (10%) respectively. North Seattle appeared to be the “hottest” market around with 64% of homes selling in the first 10 days. Again, really great numbers in Seattle given that Summer Slump was in full effect.

 Click here for the full report and neighborhood-by-neighborhood statistics!

EASTSIDE
The Eastside continues to be the region’s crown jewel of real estate. Median prices are up again year over year by 8%. Most of us felt what we lovingly call the Summer Slump, and the numbers confirmed this. Prices (median) AND transactions were down 6% overall when compared against Q2 of 2024. That’s a $100,000 dip in median sales price if you missed the spring market. This is absolutely typical for the PNW and Metro King County. Seasonally our peak seasons are spring and post Labor Day/pre-holiday. This year that may be disrupted by election distractions. Time will tell if it’s a market lacking in consumer confidence or simply existential distraction.
The micro markets across the Eastside are fairly homogeneous. Among the 8 neighborhoods that we track, the median price swing was 3-11% but all in a positive direction. Total transaction volume is up 18% signaling that eventually life changes will trump a 2.5% interest rate. While homes were mostly selling in the first 10 days, multiple offers/paying over asking price were not the norm. In fact, the split between at, above, and below was relatively even.

 Click here for the full report and neighborhood-by-neighborhood statistics!

MERCER ISLAND
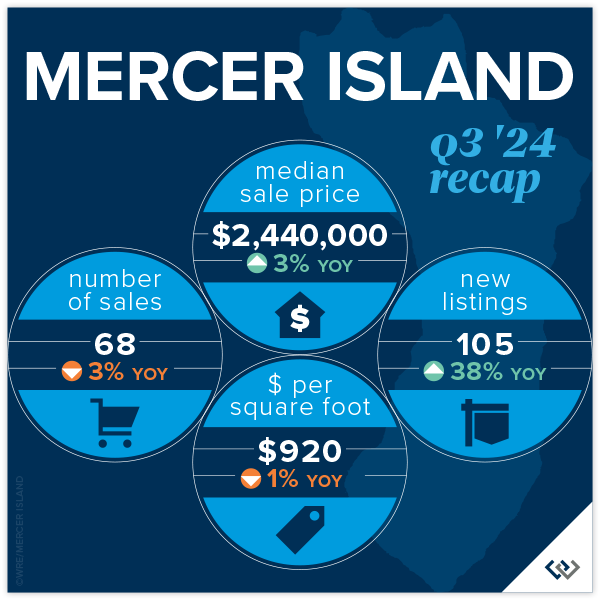
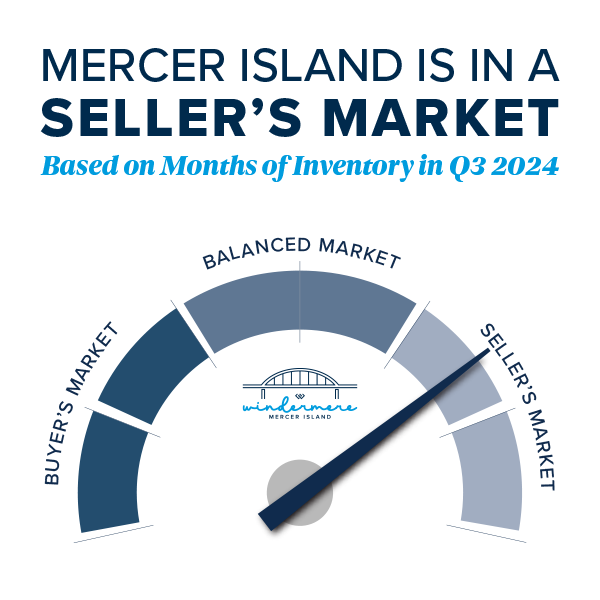
Fall has come for Mercer Island. The summer construction on Island Crest is done, school buses are out en force, and those filtered views that only come out in winter are starting to show. It’s time to look back fondly at the summer real estate market: prices are up YOY by 3% to $2,440,000 to end the quarter. This is likely more about trailing gains from a robust spring than it is about actual gains from Q3, given the indicators. A whopping 40% of homes sold under list price. It took 40% longer than 10 days to sell (not necessarily the same 40%) but only for about a 2% discount. This suggests that seller pricing and buyer motivation are evenly matched. There were 50 active listings at end of quarter, the most since Q2 of 2020 when real estate shut down completely.
Focusing on neighborhoods, The Lakes, Mercerwood, Mercerdale, and Mercer Island Estates saw 100% of homes sell in the first 10 days for an average of 102% of sales price. This goes to show that in any market, despite overall conditions, there will always be “hot homes.” Mid-Island had the most overall activity with 22 of the 68 sales across the Island. These occurred at $865/foot and 16 of the 22 homes sold in the first 10 days for at or above list price.
 Click here for the full report and neighborhood-by-neighborhood statistics!
CONDOS – SEATTLE & EASTSIDE
Once again, we’re rooting for the Seattle condo market as it proves to be the little engine that could! Chugging along toward modest price gains even when the rest of the market seems to be struggling a bit, Seattle condo prices have held steady for the last 6 quarters, with mostly positive change. Eastside condos hit a median price all-time high in Q2 at $709,000. We’re off of that a touch to $690,000 in Q3, to be expected after a beautiful summer. The Eastside ended the quarter with 29% more listings than this time last year and only 13% more sales. Mounting inventory tends to lead to price softening. Overall, nearly 50% of condos sold for at or above their list price!
When you compare the charts in the report, there is admittedly more positive news on the Eastside than in Seattle. Overall, we’re encouraged that despite many neighborhoods experiencing a drop in sales, average price per sq. ft. held flat and median price is up overall. On the Eastside it’s still great news all around for the market, especially in West Bellevue with 26% median sales price gains and total sales up 55%.
Friendly PSA: PLEASE remember that there is a ‘first rung’ of the property ladder. CONDOS create an affordable option to start building wealth at a younger age. It’s an important real estate product that has been overlooked. I am hopeful that enterprising young homeowners return to the condo market in droves this next real estate cycle.
Check out area-by-area details the full condo report.

WATERFRONT
While a bit slower compared to last quarter, waterfront sales remained strong in Q3 with 10 on the Eastside and 8 in Seattle. Lake Sammamish moderated in summer with just 5 sales compared to the crazy 15 we saw in spring, while Mercer Island stayed fairly steady with 4 (compared to 6 in spring). The highest sale was nearly $18 million for an immense Wendell Lovett designed 6,920 sq. ft. home on 125 feet of prime “gold coast” waterfront in Medina. The most modest sale was also on the Eastside—an original 1943 cottage on 53 feet of west-facing waterfront in Kennydale.
This brief overview of the entire Seattle-Eastside private waterfront market, including Mercer Island and Lake Sammamish, illustrates the trends occurring in our region over time. This data is interesting and insightful but cannot replace an in-depth waterfront analysis with your trusted professional.
We earn the trust and loyalty of our brokers and clients by doing real estate exceptionally well. The leader in our market, we deliver client-focused service in an authentic, collaborative, and transparent manner and with the unmatched knowledge and expertise that comes from decades of experience.
© Copyright 2024, Windermere Real Estate/Mercer Island. Information and statistics derived from Northwest Multiple Listing Service and Trendgraphix, and deemed accurate but not guaranteed. Seattle cover photo courtesy of Kathryn Buchanan and Brandon Larson, Clarity Northwest Photography. Mercer Island cover photo courtesy of The Sirianni Group and Clarity Northwest Photography. Condo cover photo courtesy of Julie Wilson and Bobby Erdt, Clarity Northwest Photography. Waterfront cover photo courtesy of Anni Zilz and Andrew Webb, Clarity Northwest Photography.
How’s the Market? Q2 2024 Review of Seattle Area Real Estate
Median sales prices were up across the region in Q2 of 2024 compared to this time last year, with the Eastside posting the highest year-over-year appreciation. What should you know that the numbers don’t show? We’re back to a typical PNW seasonal market. Higher temps typically lead buyers to lose focus. There is still quality inventory hitting the market. If you don’t need to sell in order to buy, this summer is the perfect opportunity for you. There are some great deals out there, and this fall election season will be in full swing which will surely have an impact on all markets.
Click or scroll down to find your area report:
Seattle | Eastside | Mercer Island | Condos | Waterfront
SEATTLE
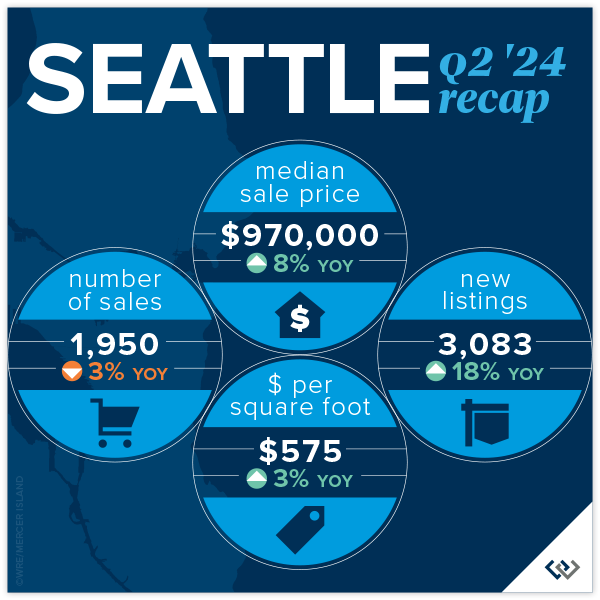
The median home price in Seattle is up 8% year over year to $970,000! We are just 3% shy of the peak median price of $1,000,000 set in Q2 of 2022. With steady growth over the last couple of quarters one might assume that we’ll hit peak prices again shortly. This gain isn’t because of low inventory (up 18%) or a rapid growth in demand (sales are down 4%), it’s likely chalked up to interest rates under 7% AND buyers got tired of sitting on the sidelines. In all cases, the first half of this year has been a breath of fresh air.
Lake Forest Park saw the biggest drop in total number of sales at 34% BUT they also saw the highest jump in median price: up 19% to $1,015,000. Their neighbors to the West, Richmond Beach and Shoreline, saw the largest rise in sales with a 19% gain in total volume AND the only area to post a drop in median price. Down 1%. Madison Park/Capitol Hill is the only other area of the city to post double digit gains. All in all a robust spring quarter.
76% of homes sold for at or above list price and 71% of homes sold in the first 10 days on the market for an average of 105% of the list price. This tells us, if you find “The One,” don’t sleep on it, and be prepared to pay. Especially in the $800,000 to $1,500,000 price band.
 Click here for the full report and neighborhood-by-neighborhood statistics!

EASTSIDE
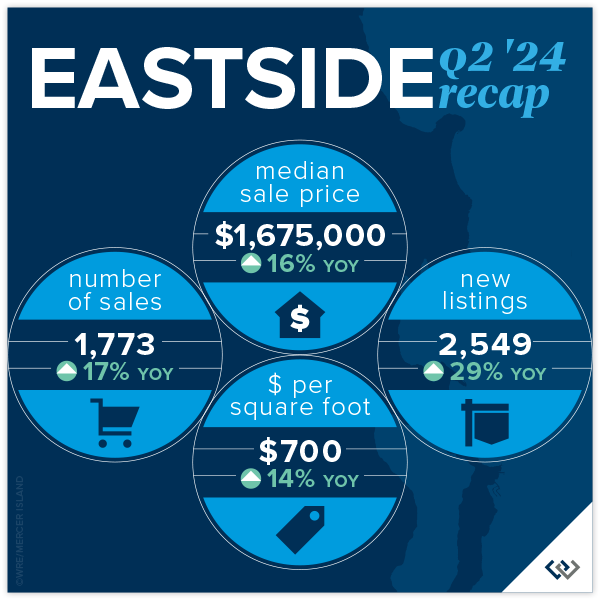
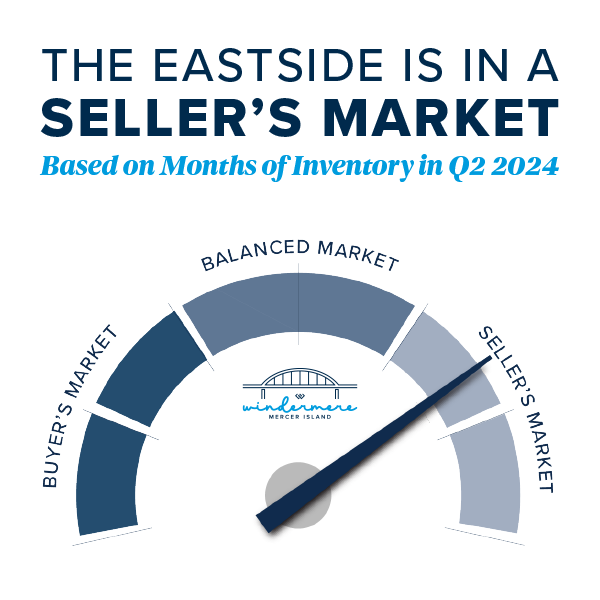
Everything’s coming up roses this spring on the Eastside. Home values have soared 16% year-over-year, with the median sale price reaching $1,675,000. This reflects a 4% gain from the peak in 2022. (Not all metro King County areas have reached peak prices again.) This impressive growth reflects a thriving market, with an average home selling for $700 per square foot, up 14% from last year. What’s even more fun? A whopping 78% of homes sold within the first 10 days of listing, showing just how bullish buyers are on the market.
Neighborhoods across the Eastside are shining. Eastside South saw 251 homes sold, marking a 37% increase, with a median sale price of $1,799,000, up 20%. Meanwhile, West Bellevue’s median sale price jumped to $3,574,000, up 13%. Mercer Island continues to charm buyers, with homes selling for an average of $906 per square foot and a median price increase of 18%, reaching $2,585,000.
Overall, the Eastside market is buzzing with activity. With 1,773 homes sold (a 17% rise YoY), it’s clear that both buyers and sellers are seizing opportunities. The increase in new listings by 29% compared to last year adds to the market’s appeal. East Bellevue and Redmond also show significant growth, with median sale prices climbing by 7% and 27%, respectively. The Eastside has staying power post Covid, clearly.
 Click here for the full report and neighborhood-by-neighborhood statistics!
MERCER ISLAND
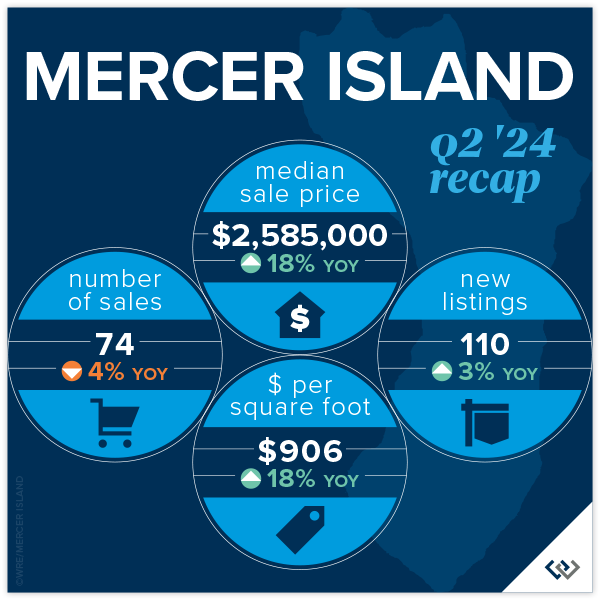
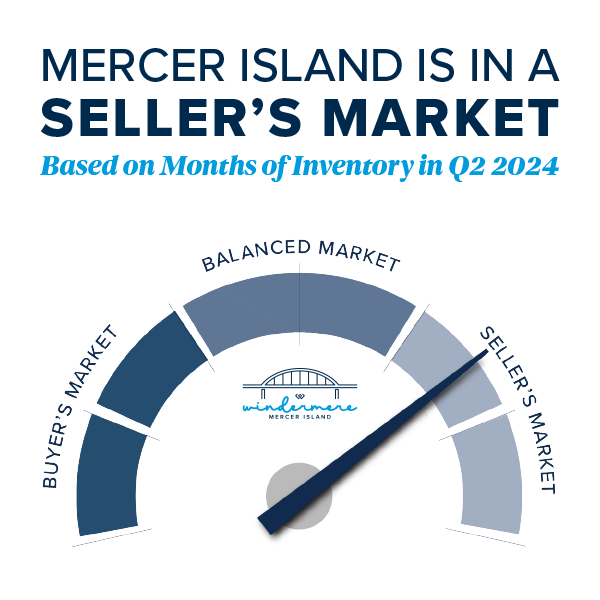
Home prices have seen a remarkable year-over-year increase of 18%, with the median sale price reaching $2,585,000. While this is a great sign for the health of the market, we’re still 5% below the 2022 peak. Affordability seems to be what is driving the market forward. Interest rates are down YoY. In relation to Q1 2024, prices are up a modest 2.5% which feels to us like: healthy sustainable growth.
Q2 2024 saw only a 3% rise in new listings compared to the same quarter last year, while there were 3 fewer homes sold in 2024 vs. 2023. Inventory and absorption remains relatively flat year over year. So it might be surprising that there is a robust demand for Mercer Island properties, with 66% of homes sold within the first 10 days of listing and that 18% rise in median price. Lower asking prices coupled with slight interest rate relief seem to be the explanation.
Taking a peek at the neighborhood snapshot reveals varying performance across different Mercer Island areas, yet the overall trend remains positive. For instance, the Northend saw 15 homes sold at an average of $810 per square foot, with 73% of these sales occurring at or above the listing price, and 60% sold within the first 10 days. On the higher end, East Seattle and The Lakes neighborhoods showcased exceptional performance, with all homes sold at or above the listing price and achieving 100% sales within the first 10 days. Overall, the average price per square foot for the island increased year-over-year, reaching $906.
 Click here for the full report and neighborhood-by-neighborhood statistics!

CONDOS – SEATTLE & EASTSIDE
It’s good news only in the condo market! Seattle condos saw modest yet positive growth, with the median sale price rising 5% year-over-year to $636,000. The average price per square foot climbed to $649, a 7% increase, showing strong market demand. Condos in Ballard and Green Lake led the charge with a 31% increase in sales volume, while Downtown-Belltown, despite a 14% drop in sales, saw prices rise by 10%. Demand seems to be all over the board, but we’re still reporting the highest median sales price ever for Seattle condos!
On the Eastside, the market was buzzing with activity, in large part due to inventory being double what it was in Q2 of 2023. Redmond condos were the stars, with sales skyrocketing by 65% and the median sale price jumping 45% to $850,000. West Bellevue followed suit with a 38% increase in sales and a 33% hike in price per square foot, reaching $1,064. The overall Eastside market saw a 22% rise in sales and a 13% increase in the average price per square foot, now at $660.
It’s important to note that 62% of all condos selling at or above their list price across Seattle and the Eastside, showing a competitive market where buyers are eager to snap up properties quickly. With more new listings than last year there are plenty of opportunities for buyers and sellers alike. Whether you’re eyeing a trendy spot in Ballard or a luxurious condo in West Bellevue, the upbeat condo market promises exciting possibilities for everyone!
Friendly PSA: PLEASE remember that there is a ‘first rung’ of the property ladder. CONDOS create an affordable option to start building wealth at a younger age. It’s an important real estate product that has been overlooked. I am hopeful that enterprising young homeowners return to the condo market in droves this next real estate cycle.
Check out area-by-area details the full condo report.
WATERFRONT
Lake Sammamish led the pack in Q2 with a whopping 15 waterfront sales, while the Eastside was close behind with 12. Of Seattle’s 9 waterfront sales, all but 2 sold in less than 10 days. It was a similar story with Mercer Island’s 6 sales—all but 1 sold in less than 10 days and 4 sold above the asking price. Meydenbauer took the crown for largest waterfront sale, fetching $21.3 million for a truly stunning 1-acre estate with 164 feet of waterfront and a palatial 11,000+ sq. ft. home. The most modest waterfront sale was a Rainier Beach gem on 50 feet of waterfront that sold in just 8 days for $1,725,000.
This brief overview of the entire Seattle-Eastside private waterfront market, including Mercer Island and Lake Sammamish, illustrates the trends occurring in our region over time. This data is interesting and insightful but cannot replace an in-depth waterfront analysis with your trusted professional.
Main photo courtesy of Wing Walker Aerial Photography
We earn the trust and loyalty of our brokers and clients by doing real estate exceptionally well. The leader in our market, we deliver client-focused service in an authentic, collaborative, and transparent manner and with the unmatched knowledge and expertise that comes from decades of experience.
© Copyright 2024, Windermere Real Estate/Mercer Island. Information and statistics derived from Northwest Multiple Listing Service and Trendgraphix, and deemed accurate but not guaranteed. Seattle cover photo courtesy of Codi Nelson and HD Estates Photography. Eastside cover photo courtesy of Donovan Realty Group and Tucker English Photography. Mercer Island cover photo courtesy of Yvonne Willard and Ryan Slimak, Clarity Northwest Photography. Condo cover photo courtesy of Luke Bartlett and Matthew Gallant, Clarity Northwest Photography. Waterfront cover photo courtesy of Kathryn Buchanan and Brandon Larson, Clarity Northwest Photography.
How’s the Market? Q1 2024 Review of Seattle Area Real Estate

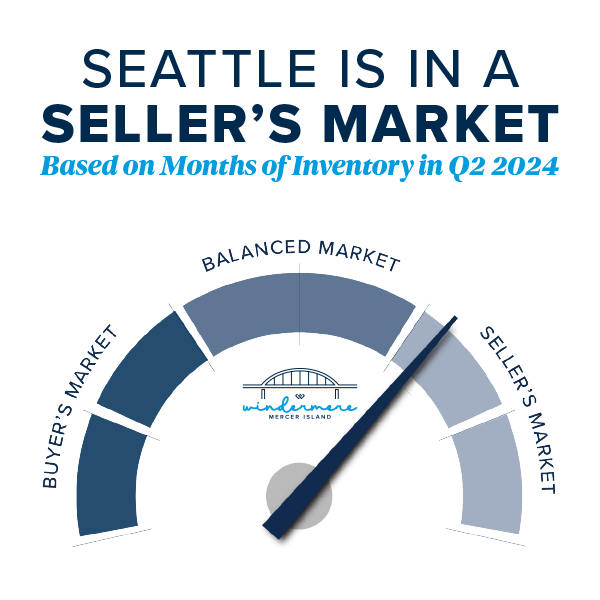
The Seattle/Eastside real estate market is hot and the Q1 stats support the claim; most homes sold in the first 10 days and either at or above their listed prices. Eastside median sales prices saw double-digit gains of 14% compared to this time last year, while Seattle was close behind with a 9% price bump. We saw more new listings this year than in Q1 of 2023; however, this was not enough to tip the scales and we remain staunchly in a seller’s market for the foreseeable future. The good news for buyers is that interest rates have stabilized and more sellers are jumping off the fence to list their homes. Competition for prime properties will remain high, however, so buyers should be prepared to take a leap of their own when the right home presents itself.
Click or scroll down to find your area report:
Seattle | Eastside | Mercer Island | Condos | Waterfront
SEATTLE
It’s safe to say the spring market hit early in Seattle! We’ve seen a 9% rise in median home price and 69% of listings selling at or above list price, all while interest rates are in the mid 6s. We are bullish on the year to come. Overall sales are down 3% YoY, which is slightly troubling because Q1 2023 saw a 28% dip from the previous year. If you dig a little deeper it seems that the north end (Kenmore and Lake Forest Park) saw a 42% reduction in overall sales with a 30% increase in median price.
Prices are up across the board. The largest jumps in median price are in Lake Forest Park and North Seattle (30% and 23% respectively), while the highest $/sq.ft. jumps were in Madison Park and South Seattle. 56% of all homes on the west side sold in the first 10 days and for an average of 105% of list price. This is a great indicator that the market will continue to be strong in Q2.
The total number of new listings remains relatively low in the city, when compared with years past. This is to be expected as current homeowners stay put to enjoy their cozy sub-3% interest rates. We hope that equity will begin burning holes in their pockets soon—the market could use the inventory. If you’ve been thinking about buying, this could be your year! Get pre-approved and be ready to jump when you see the right home come available.
If you’ve thought about selling your home, it may be a good year to do so. As is typical in the early stages of appreciating cycles, buyers are brought off the fence by “the house” popping up—and they’re paying premiums for cream puff properties. Interest rates have stabilized and experts say they may become even more favorable as the year progresses. Check with your agent about your own unique situation.
Click here for the full report and neighborhood-by-neighborhood statistics!

EASTSIDE
The numbers are in and the statistics reflect what agents and consumers have felt thus far in 2024—the market is hot. Median home prices on the greater Eastside are up 14%. 65% of all listed homes sold in the first ten days for an average of 105% of list price. The communities that have posted the largest gains are Kirkland and the area South of I-90 (32% and 21%). Redmond and West Bellevue reported much more conservative median price increases at 4%. The total number of pending homes was up 18% YoY, which bodes well for continued price gains.
If you’re in the market to purchase a home on the Eastside we are hopeful for more inventory this year. Even though rates are still nowhere near their all-time lows, which was the anecdotal explanation for lack of inventory in 2023, it seems that a Q1 sales boom is enough to help potential home sellers feel bullish on 2024. This means you can also expect competition for the prime properties. Our best home buying advice: do your research, act with confidence, and remember real estate is a long-term investment.
If you’re a homeowner thinking about a home sale in 2024, Q2 could be the perfect time. Shoppers are out in droves and they’re prepared to pay top dollar for quality product. The steep jump in median home price should continue at least into Q2. The only threat in Q3 and Q4 is what could shape up to be a distracting election cycle. Though, the election year is likely what is keeping downward pressure on rates. Our best home selling advice: follow your agents’ guidance on timing as it’s sure to be a volatile year. Prep hard and price conservatively. It will all work out in your favor.
Click here for the full report and neighborhood-by-neighborhood statistics!

MERCER ISLAND
What a difference a year makes! In Q1, Mercer Island’s median sale price is already up 13% over a relatively flat year in 2023, rising from around $2,200,000 to $2,520,000. We’re seeing shorter market times and multiple offers; spring has sprung on the Island. With 59 new listings and 37 closed sales inventory appears to be tracking with what we’ve seen in Q1 in years past. That said, condos continue to lag behind single family: only 6 closed sales all quarter. The average price per square foot is $535—about where it’s been tracking since it jumped from $485 in Q1 of 2021. Not a lot of shocking change here.
If you’re in the market to purchase a home on Mercer Island you can expect better inventory this year than last year. Even though rates are still nowhere near their all-time lows, which was the anecdotal explanation for low inventory in 2023, it seems that a Q1 sales boom is enough to help potential home sellers feel bullish on 2024. This means you can also expect competition for the prime properties. Our advice: do your research, act with confidence, and remember real estate is a long-term investment.
If you’ve been thinking about selling your home to upgrade or downsize, Q2 could be the perfect time. Shoppers are out in droves and they’re prepared to pay top dollar for quality product. The steep jump in median home price should continue at least into Q2. The only threat in Q3 and Q4 is what could shape up to be a distracting election cycle. That being said, the election year is likely what is keeping downward pressure on rates. Our advice: follow your agents’ guidance on timing as the situation develops this year. Prep hard and price conservatively. It will all work out in your favor.
Click here for the full report and neighborhood-by-neighborhood statistics!

CONDOS – SEATTLE & EASTSIDE
It seems a healthy start to 2024 in the condo market. While the Q1 of 2023 numbers were down across the board, Q1 of 2024 is looking up with a combined rise in price of 15% and 34% more fresh new listings (YoY).
On the Eastside there were 202 active listings available at the end of the quarter, while 501 homes accepted offers during the quarter. This was the highest number of pendings in one quarter in the last two years! To real estate professionals, “pendings” are the canary in the coal mine of the market. A spike in pendings is a predictor that the market is heating up.
In Seattle new listings doubled from Q4 2023 (534) to Q1 2024 (1019), while pendings and solds are up 20% YoY. If you’re shopping for a condo, keep an eye out for enticing new inventory in Q2. 42% of Seattle condos sold in the first 10 days and for 100% of the list price. 44% of condos took more than 30 days to sell, though they still commanded 97% of their list price. To me this means that pricing is more important than ever in determining your outcome.
Now it’s time for me to stand on the home ownership soap box. There seem to be a lot of headlines about the unaffordability of single family homes. While there is no denying how expensive it is, there is a missing piece to the story: at some point during the prolonged period of “cheap money” first time buyers forgot about the first rung of the property ladder. CONDOS create an affordable option to start building wealth at a younger age. It’s an important real estate product that has been overlooked. We are hopeful that enterprising young homeowners return to the condo market in droves this next real estate cycle.
Check out area-by-area details the full condo report.
WATERFRONT
Seattle and the Eastside each had 6 waterfront sales in the first quarter, with 4 out of the 6 sales for both areas closing at or above the listing price (including one unlisted sale). All of the Eastside’s listed sales were on the market for only 8 days or less. Lake Sammamish was close behind with 5 sales (however 4 out 5 sales went below the asking price) and Mercer Island lagged behind with just 1 sale. Medina boasted the largest waterfront sale, a newer home on 117 feet of lakefront with a mind-blowing 13,590 interior square feet and 1.5 acres of grounds. The most modest sale was for a Lake Forest Park home on just 40 feet of waterfront—it sold almost immediately for 7% above its asking price.
This brief overview of the entire Seattle-Eastside private waterfront market, including Mercer Island and Lake Sammamish, illustrates the trends occurring in our region over time. This data is interesting and insightful but cannot replace an in-depth waterfront analysis with your trusted professional.
We earn the trust and loyalty of our brokers and clients by doing real estate exceptionally well. The leader in our market, we deliver client-focused service in an authentic, collaborative, and transparent manner and with the unmatched knowledge and expertise that comes from decades of experience.
2737 77th Ave SE, Mercer Island, WA 98040 | (206) 232-0446
mercerisland@windermere.com
© Copyright 2024, Windermere Real Estate/Mercer Island. Information and statistics derived from Northwest Multiple Listing Service and Trendgraphix, and deemed accurate but not guaranteed. Seattle cover photo courtesy of Brooke Davis and Emerald City Snap. Eastside cover photo courtesy of Team RAREnorthwest and Clarity Northwest Photography. Mercer Island cover photo courtesy of Nancy LaVallee and Clarity Northwest Photography. Condo cover photo courtesy of Michael Fleming and Clarity Northwest Photography.
How’s the Market? An Annual Review of Seattle Area Real Estate

Median home sales prices across the region saw a year-over-year dip compared to 2022, with prices settling just above their 2021 levels. That being said, most homes still sold within the first 10 days on the market and either at or above the listing price. Today’s higher rates, in concert with constricted inventory, have slowed the total number of sales. Should rates ease like experts are predicting, however, we will see more people enter the market and hopefully more listings will follow. (Read more about that in our full 2024 forecast).
Click or scroll down to find your area report:
Seattle | Eastside | Mercer Island | Condos | Waterfront
SEATTLE
Would you like the good news or the bad news? Bad: Overall home prices slid in the city by 7%. Good: 57% of all homes sold in the first 10 days and for 104% of list price. While we may have backed off of our head spinning pandemic list/sale percentages, we’re still going strong. To us what this means is: if you’re considering selling there is probably a buyer ready and waiting to make you an offer. It just won’t be quite as lucrative as it might have been in 2022. It could be a lot worse given the high cost of money in 2023. Homeowners certainly came out ahead and Seattleites have our chronically low inventory and stable job market to thank for this!
We finished the year with sales down 23%, a figure made a lot less scary by the fact that listings were also down city wide by 24%. North Seattle east of I-5 saw the most stable prices, only losing 2% at a median price of $976,000. Queen Anne/Magnolia lost 10%, closing out the year at $1,263,000. It’s also interesting to note that 65% of homes sold for list price or better. This means we have mostly well counseled homeowners with reasonable expectations of what the market will bear.
If you’re in the market for a new home in 2024, Q1 is a great time! Inventory hasn’t been this low since 2012. If the cost of money goes down—as many experts are predicting—and more people decide to purchase, it could get very competitive very quickly! Beat the rush!
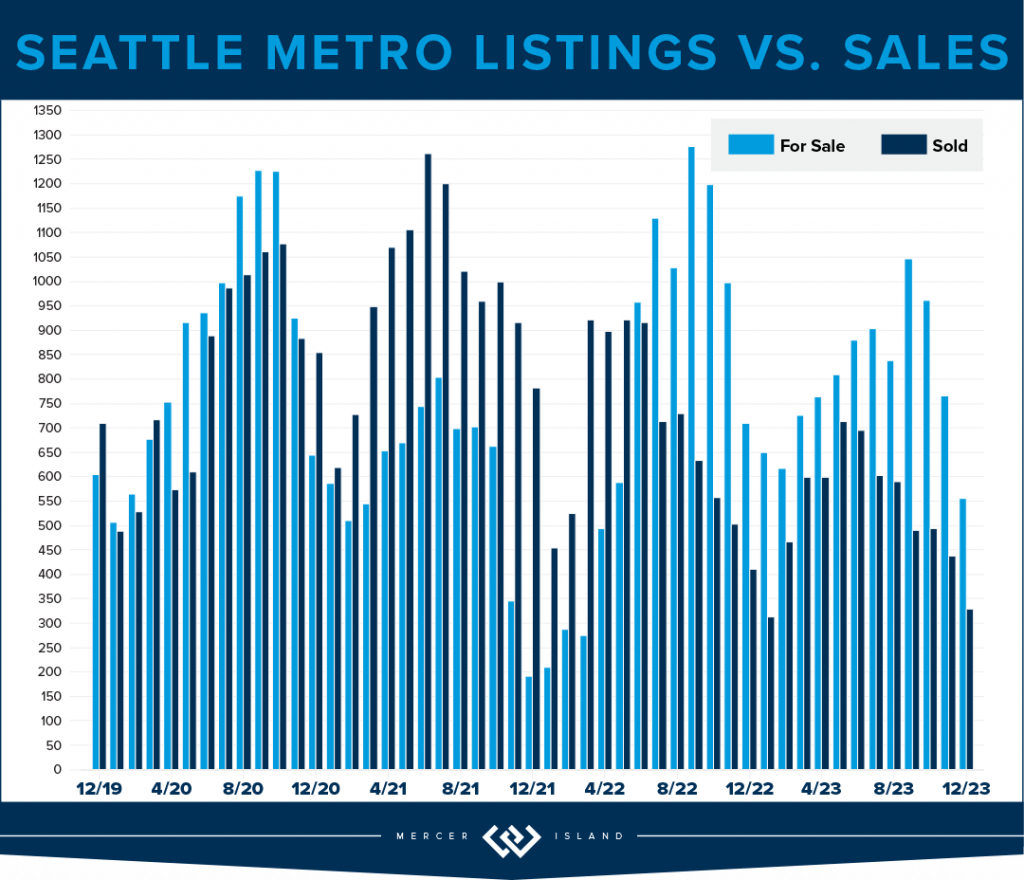
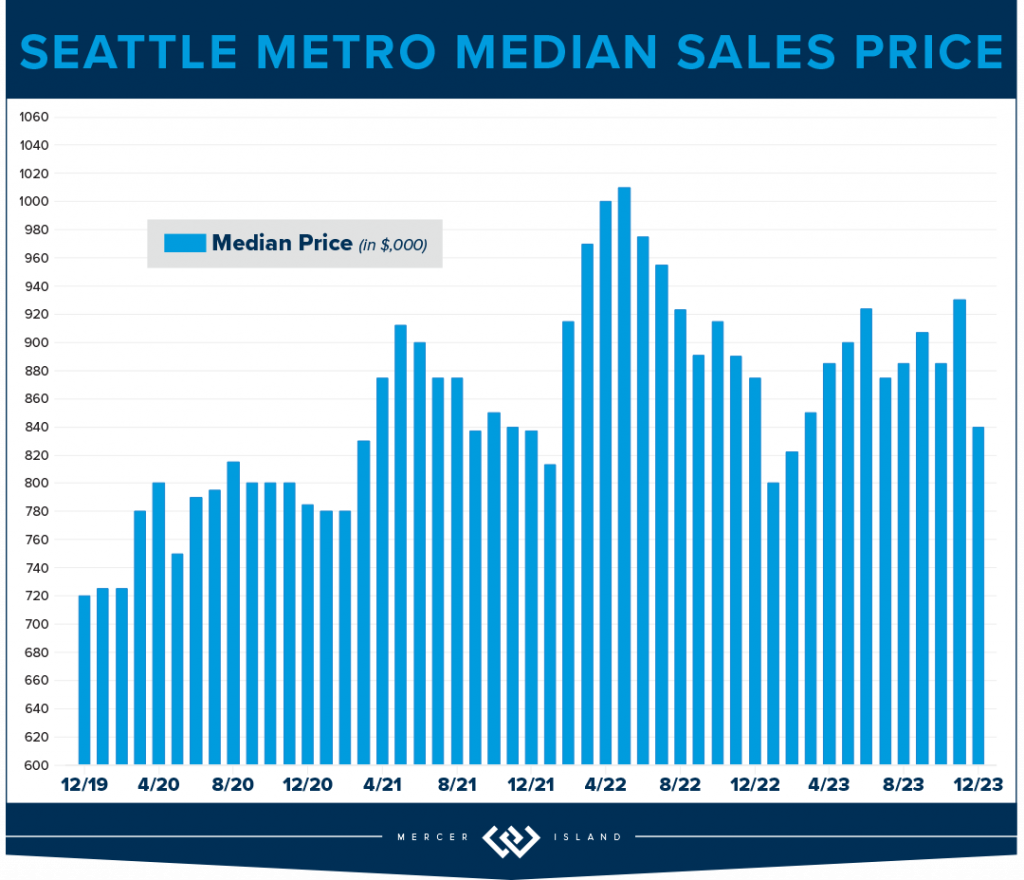
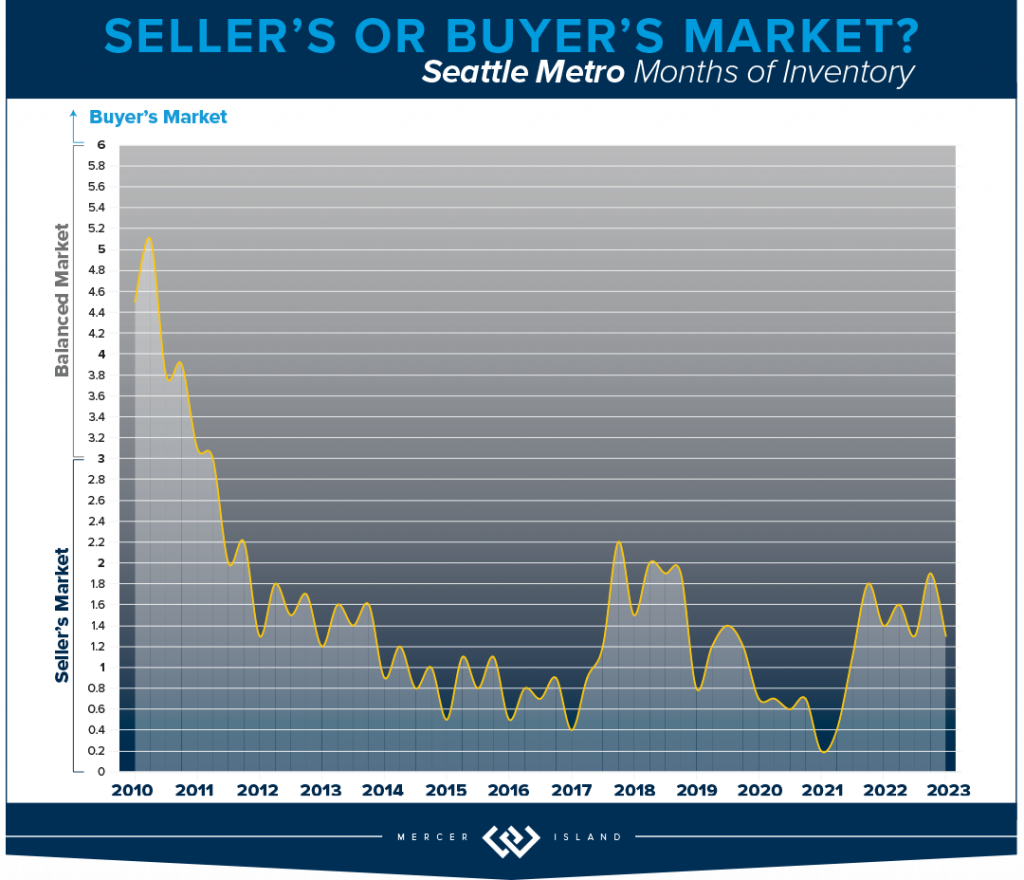
Click here for the full report and neighborhood-by-neighborhood statistics!
EASTSIDE
The Eastside median sales price was down by 4% as we closed out 2023. This is in large part due to the interest rates. It certainly isn’t supply and demand: Total listings were down 29% while sales only dipped 18% YOY. That’s staggering. Buyers and Sellers did not seem to be aligned in their estimation of the market: only 55% of homes sold for at or above list price while 45% needed a reduction or negotiation prior to accepting an offer. While this sounds balanced, it’s out of the norm compared to our historic data.
Sammamish was the strongest overall area with a whopping 1217 sales (25% of the total 4954) and the lowest median price dip of 3%; $1,400,000 in 2023 v. $1,450,000 in 2022. Mercer Island was the hardest hit with a 12% drop in median price to $2,239,000—the lowest since 2020. Corrections are healthy for the long-term health of a real estate market. We’re not sure how long this one will last; all signs are pointing to continued low inventory. It seems to be a game of chicken with the interest rates that could lead to massive pent-up demand.
If you’re in the market for a new home in 2024, Q1 is a great time! Inventory is at its absolute 15 year low (6,140 listings compared to a high of 10,880 in 2010) which means we are poised for a market flip. If the cost of money goes down—as many experts are predicting—and more people decide to purchase, it could get very competitive very quickly! Beat the rush!
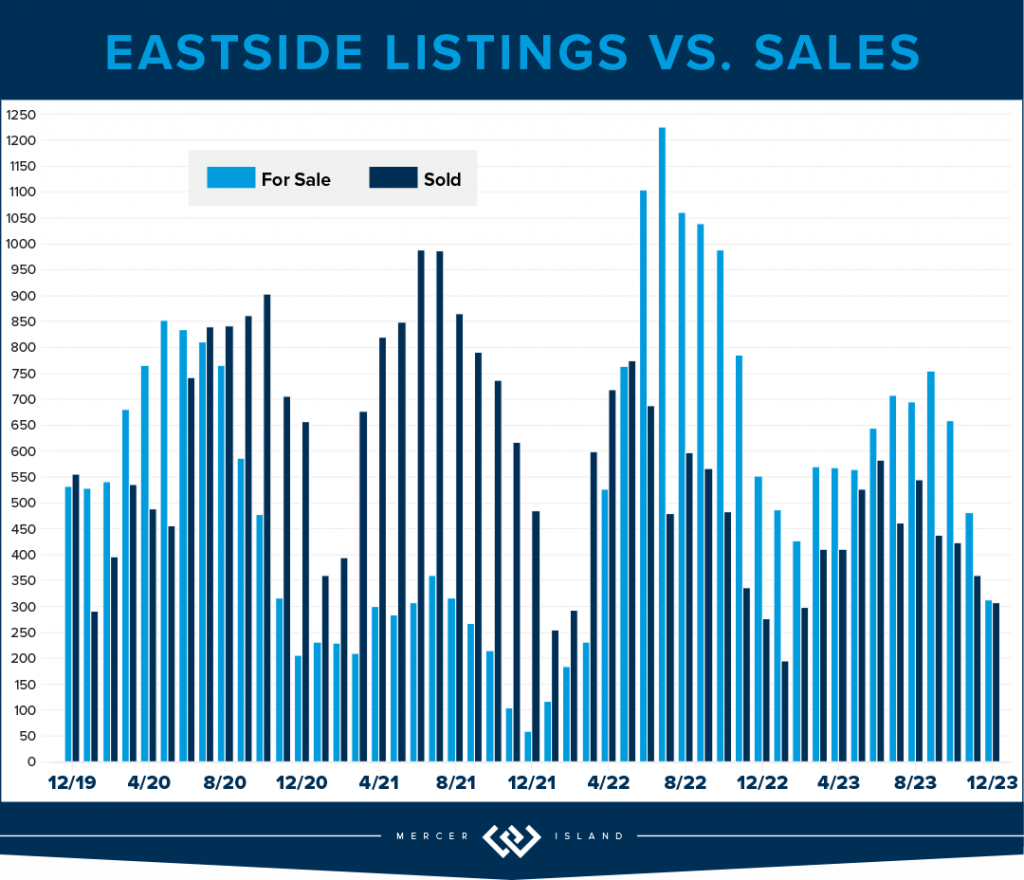
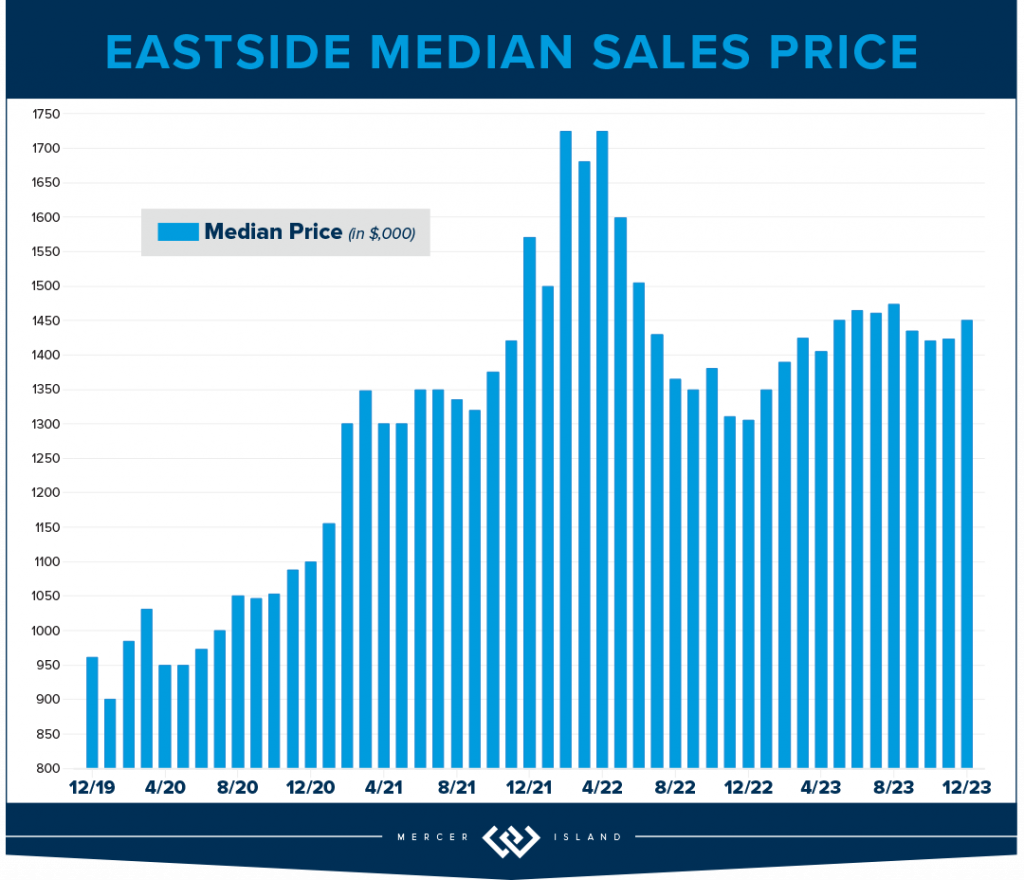
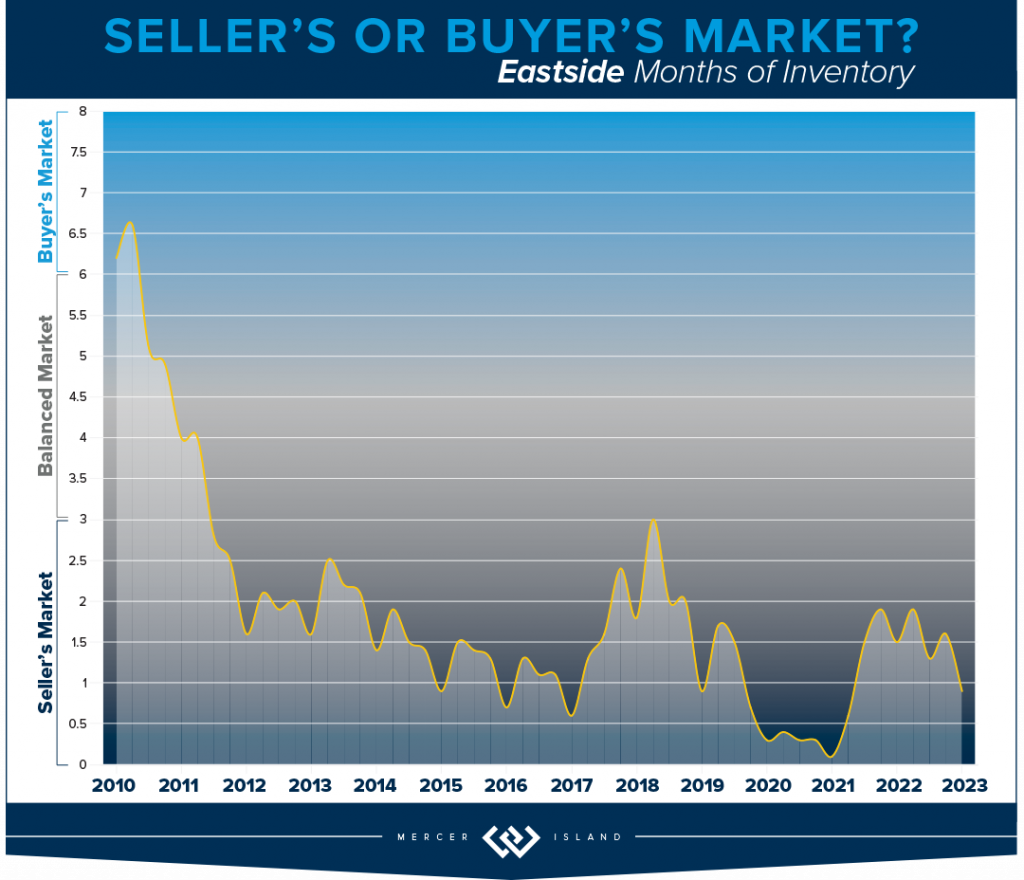
Click here for the full report and neighborhood-by-neighborhood statistics!
MERCER ISLAND
The Island saw just 289 new listings last year, only 60% of the peak 488 in 2013. There are some numbers that show we had very realistic homeowners in 2023: a 78% absorption of listings, (222 sales, up from 218 in 2022) and 98% list/sale price. When buyer and seller expectations meet, magic happens. The median price in 2023 was $2,239,000 back to around the same level as 2021—if you remember, this was a 30% increase from $1,700,000 in 2020.
Condos on the Island are off 8% to $620,000 from the 2022 high of $674,000, this is a strong showing. For the previous 4 years (2018-21) median prices were in the $500’s. There were only 33 sales Island-wide, the lowest number of total sales in 15 years. Listings were down as well: the lowest level since 2012. The metrics show that the market was strong, even with the dip in median sales price: 19 days on market, 99% list/sale price ratio, on average only 4 listings were active at one time. These are all signs of a constricted inventory/sellers’ market, which is what will eventually drive prices higher.
All in all, MI is holding strong to the price gains made during the pandemic. We are bullish on our market in 2024 as interest rates are easing. Time will tell.
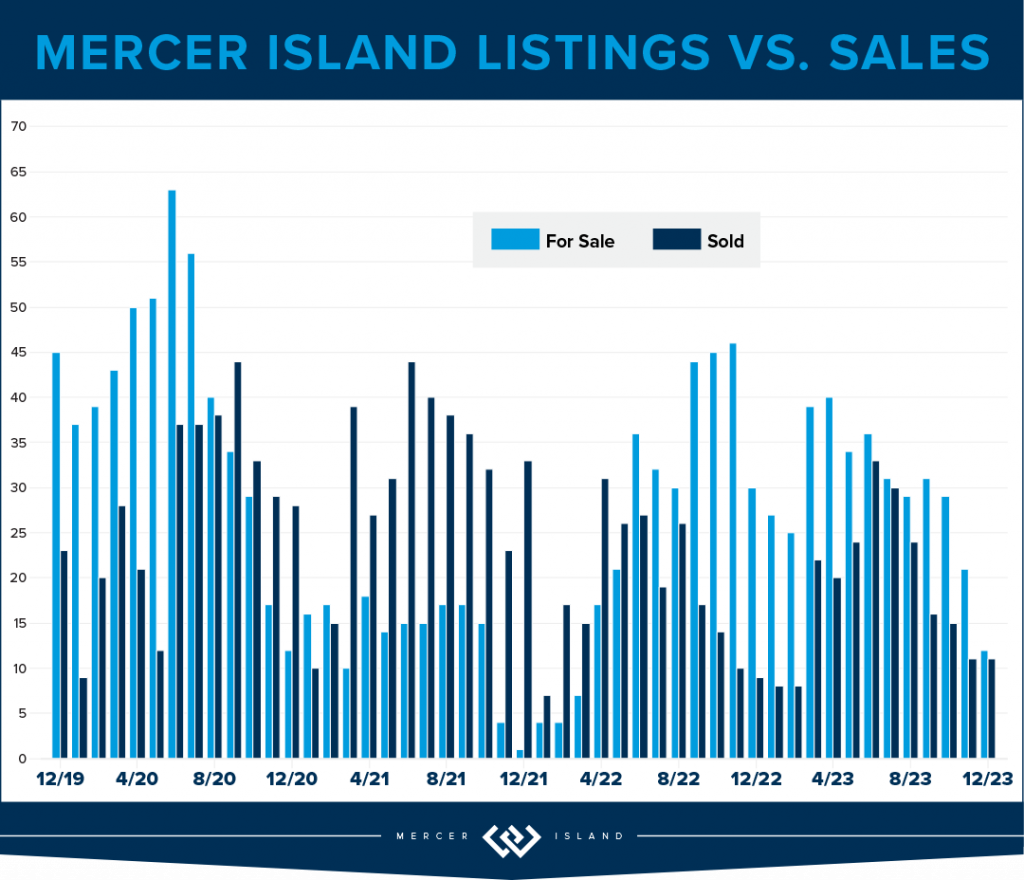
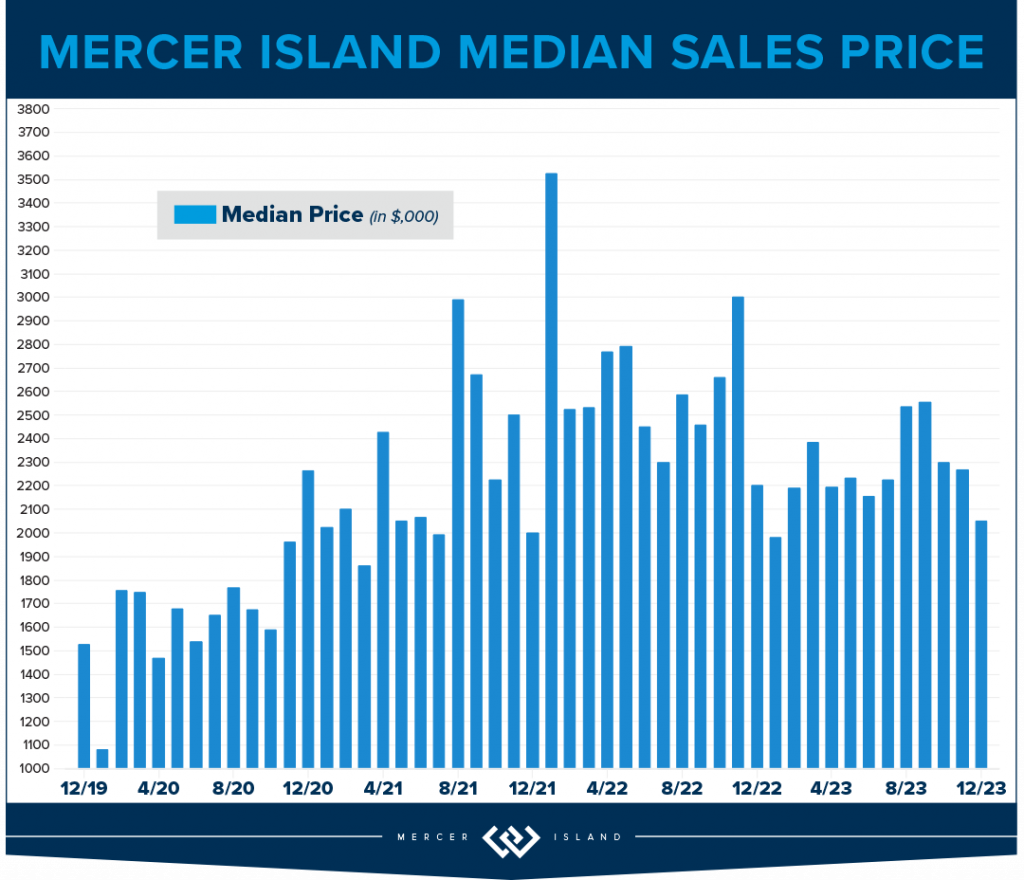
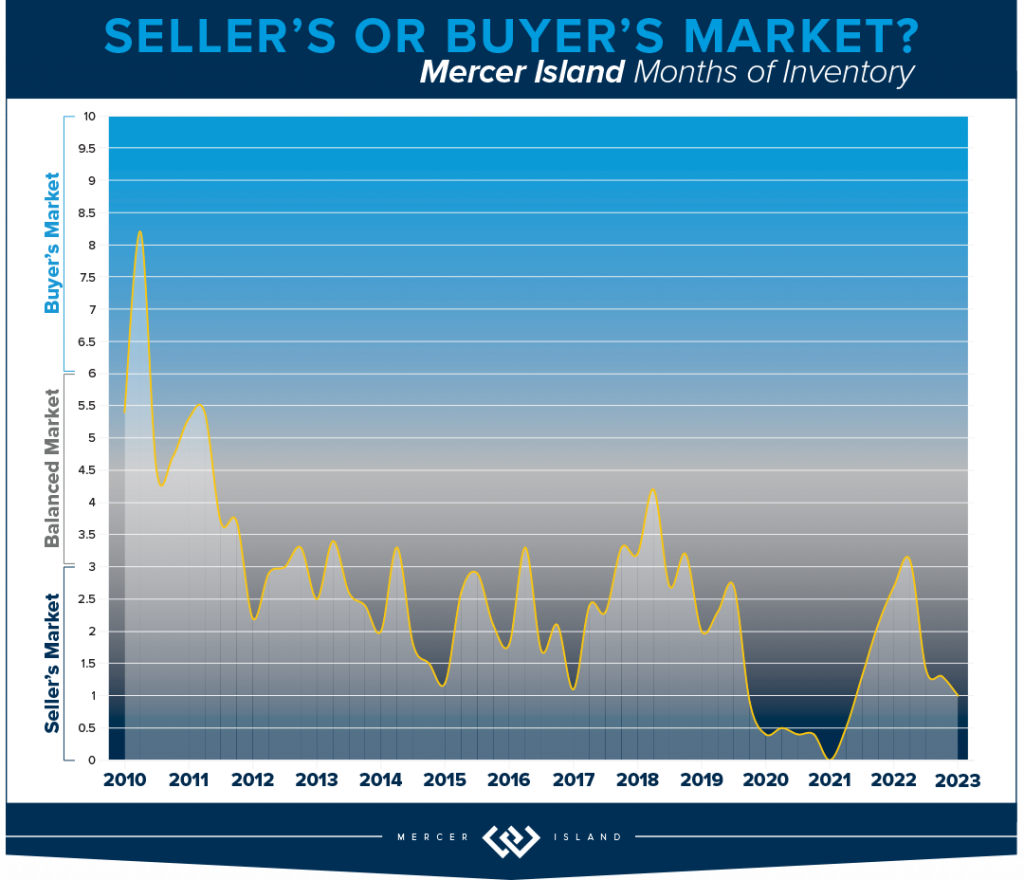
Click here for the full report and neighborhood-by-neighborhood statistics!
CONDOS – SEATTLE & EASTSIDE
Whew! What a year! The major condo headline for both Eastside and Seattle condos: Prices hold steady while demand dips 25%! While this is sensationalized, it’s true. Likely due to the fact that inventory was also down by 20%, which means that supply and demand remained aligned and shielded homeowners from what could have been a massive hit to their bottom lines.
On the Eastside, when the dust settled, prices are down by 1%. The largest drop in median price was East Bellevue losing 11% while Kirkland soared above all other neighborhoods with double digit gains (up 19%). Other areas of note: West Bellevue topped the charts with a median sale price of $880,000! This is higher than the $876,000 residential median sale price in the city of Seattle.
Speaking of Seattle, the condo market in the city reminds us of The Little Engine That Could. Chugging merrily along despite having the odds stacked against it: I think I can! Overall, the city posted a 5% gain year over year with record high median sales price of $546,000. Downtown saw the highest overall unit volume at 439 total sales, while Greenlake/Ballard boasted the highest overall gain in median price at 15% appreciation. All good news, finally.
Check out area-by-area details the full condo report.
WATERFRONT
While Seattle and the Eastside both posted fewer waterfront sales in 2023 than in 2022, Lake Sammamish saw a big 40% year-over-year jump in sales. Mercer Island’s sales increased by a more modest 10%.
The highest waterfront sale of 2023 was $20 million for a breathtaking Evergreen Point estate on 115 feet of prime low-bank shoreline. Listed by Windermere and truly unique with a custom home designed by Hal Levitt, it sold its first day on the market (and well above the $18.5m asking price!).
The most modest waterfront sale was a 1,749 sq. ft. Lake Sammamish home sold by the owner for $1.62 million. It featured 25 feet of lakefront and big lake/mountain views.
Click here for the full waterfront report with top sales for the entire Seattle-Eastside private waterfront market, including Mercer Island and Lake Sammamish. The data is interesting and insightful (but cannot replace an in-depth waterfront analysis with your trusted professional).

We earn the trust and loyalty of our brokers and clients by doing real estate exceptionally well. The leader in our market, we deliver client-focused service in an authentic, collaborative, and transparent manner and with the unmatched knowledge and expertise that comes from decades of experience.
© Copyright 2024, Windermere Real Estate/Mercer Island. Information and statistics derived from Northwest Multiple Listing Service and Trendgraphix, and deemed accurate but not guaranteed. Seattle cover photo courtesy of Team RAREnorthwest and Baylee Reinert with Clarity NW Photography. Eastside cover photo courtesy of Donna Cowles and Kelly Morrissey with Clarity NW Photography. Mercer Island cover photo courtesy of the Oordt Ceteznik Realty Group and Clarity NW Photography. Condo cover photo courtesy of Fred Fox and Brandon Larson with Clarity NW Photography. Waterfront cover photo courtesy of Anni Zilz and Andrew Webb with Clarity NW Photography.
How’s the Market? Q3 2023 Review of Seattle Area Real Estate

While median sales prices varied quite a bit from area to area, they stayed relatively stable with most communities posting either modest gains or slight declines compared to this time last year. Low inventory is keeping us in what you might call a “flat” seller’s market…supply is low but prices aren’t appreciating as fast as we would normally see. That being said, if rates float down—and experts believe they will—we could see another frenzy of bidding wars as buyers compete for the few homes on the market. If you’re considering purchasing a home (even if you need to sell yours first), our advice is to get out there and start shopping while you can pick and choose at relatively reasonable prices…
Click or scroll down to find your area report:
Seattle | Eastside | Mercer Island | Condos | Waterfront
SEATTLE
The Seattle residential market showed resilience in Q3 of 2023. While the $894,000 median sales price was down 3% from last year, 60% of sellers fetched sales at or above their list price and 58% sold within the first 10 days. The city saw 2,321 new listings, a 23% reduction from the previous year. This is healthy, for now, with decreased demand due to rising interest rates. When rate pricing eases—and it will according to experts—the lower inventory will be sure to send prices through the roof. NOW IS THE TIME!
Diving deeper into communities, Queen Anne, with its blend of historic charm and modernity, saw a 1% rise in median sales prices to $1,349,000. Kenmore and Lake Forest Park have also held their own—60% of homes sold within the first ten days and both median sales prices and cost-per-square-foot went up 2% over last year. North Seattle remains a strong contender in the market, with 68% of homes selling at or above the list price. West Seattle, with its coastal vibe, saw a remarkable 72% of homes sell at or above the listing price.
The data underscores Seattle’s diverse and dynamic housing landscape, where different communities cater to varied tastes, yet all show promise and potential. Overall, Seattle’s housing market is marching on, optimistically steady, backed by strong analytical data and historically low unemployment.
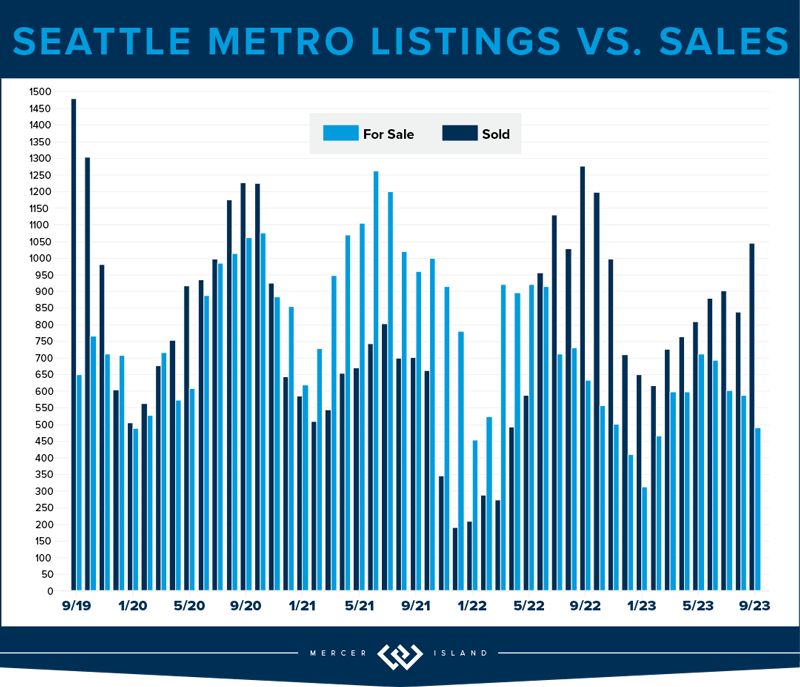
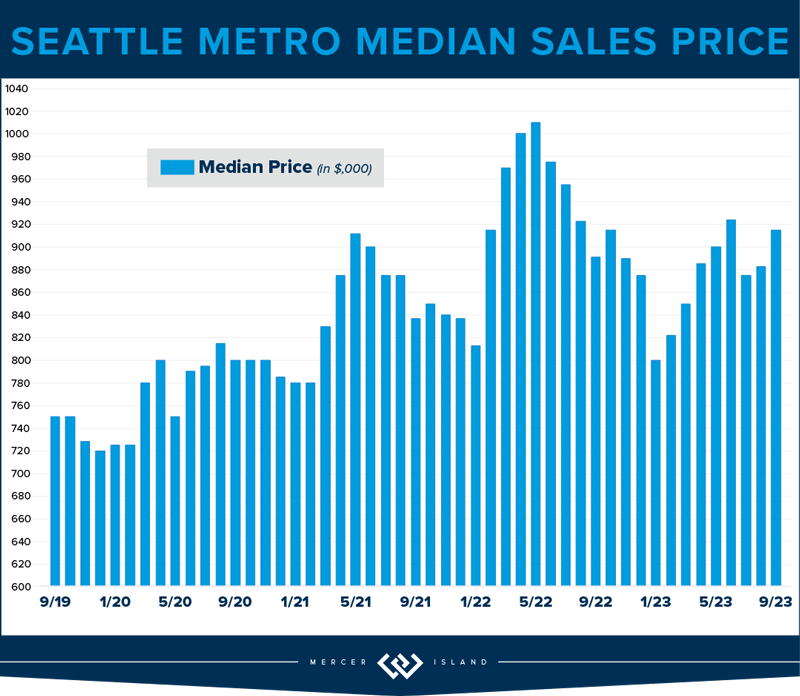
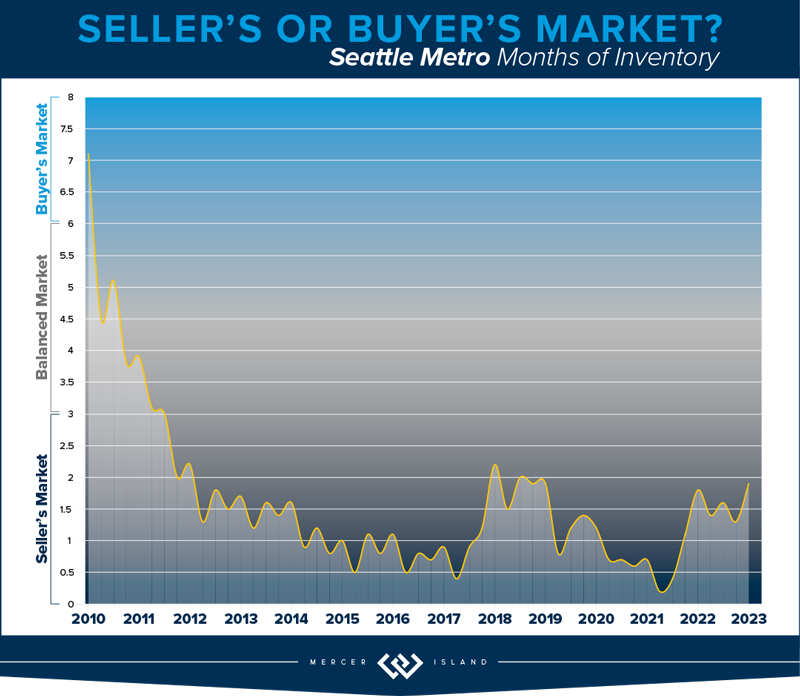
Click here for the full report and neighborhood-by-neighborhood statistics!

EASTSIDE
The Eastside showed steady growth in Q3. With a notable 5% year-over-year rise in home values, the median sales price landed at a respectable $1,460,000. Interestingly, cost per square foot ($625) showed virtually no YOY change. Sellers saw a close alignment with their expectations, as the average list price to sale price for all properties stood at 99%. Furthermore, 58% of homes sold at or above their listing price, a testament to the region’s enduring demand.
Diving deeper, most communities remained fairly stable with modest year-over-year increases. Redmond, Mercer Island and Newcastle/North Renton saw slight declines. The star of the Eastside was West Bellevue, posting 23% more sales than Q3 of last year, a median sales price hike of 14%, and the highest cost-per-square-foot in the region (even after a 14% drop from last year). While overall sales were down about 13% across the region, this was counterbalanced by a 20% drop in new listings keeping the Eastside in a flat seller’s market for the foreseeable future.
Our conclusion? The Eastside’s market remains robust and versatile. Buyers and sellers both need to be savvy, understanding both their micro-markets and the broader trends. For sellers, strategic pricing and presentation remain king! Our advice to buyers: don’t sleep on this market, it will turn fast when interest rates float downward and inventory will not be able to keep up with demand.
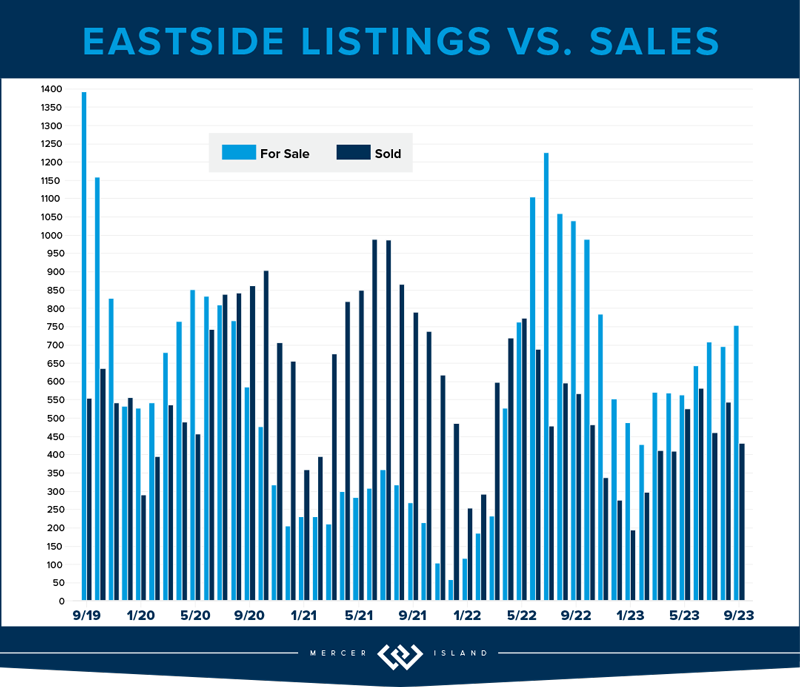
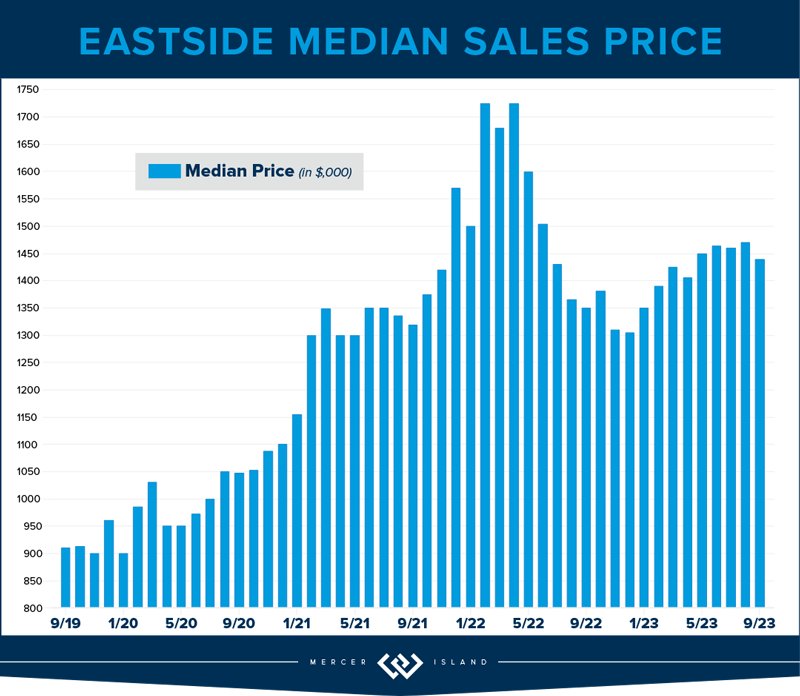
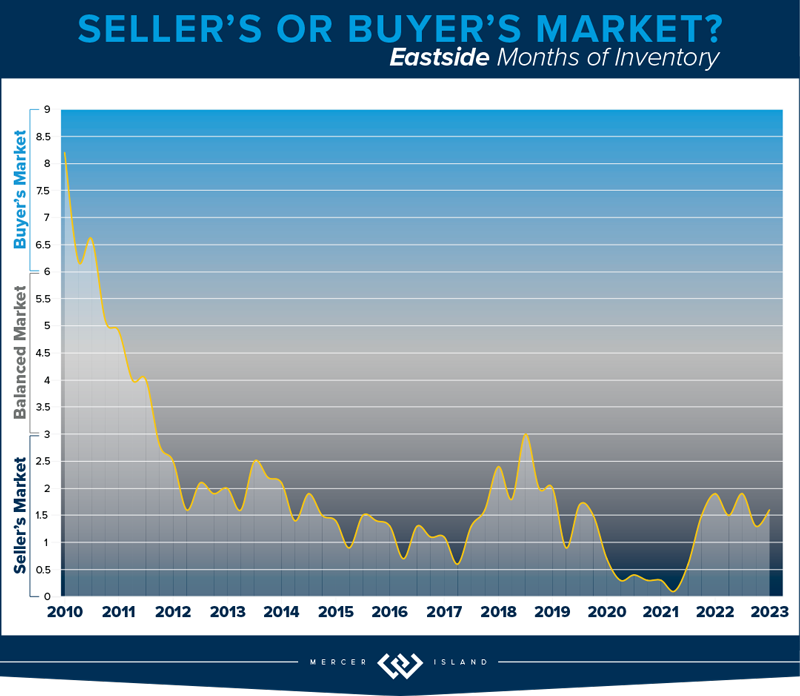
Click here for the full report and neighborhood-by-neighborhood statistics!

MERCER ISLAND
While Mercer Island’s Q3 median sales price of $2,368,000 was still down slightly compared to Q3 of last year, prices have been trending upward since the beginning of the year. Furthermore, the average price-per-square-foot in Q3 was actually up 6% over last year. More than half of homes sold at or above their list prices (53%) and in 10 days or less (57%)—this is right on par with what we saw in Q3 of 2022. Buyers found room to negotiate on the remaining listings and were able to add contingencies for things like inspections and financing.
We saw a boost in sales compared to last year’s initial interest rate shock, despite a lower number of new listings. This has kept the Island in a flat seller’s market much like we saw in 2018. That being said, Mercer Island homes are taking longer to sell than we saw last year—the average total number of days properties spent on the market before receiving an offer went from 18 days in Q3 2022 to 30 days by Q3 2023. Buyers, perhaps more hesitant due to higher interest rates, are being careful to pick and choose before leaping into a contract.
Overall, the Mercer Island real estate market has remained fairly steady with some signs of growth. While median prices are still down from their spike during the post-COVID frenzy, we should start seeing year-over-year gains if this year’s upward trend continues. For prospective buyers, the landscape offers an opportunity to negotiate favorable deals on those properties that don’t sell right away. For sellers, astute pricing and marketing strategies will continue to win the day.
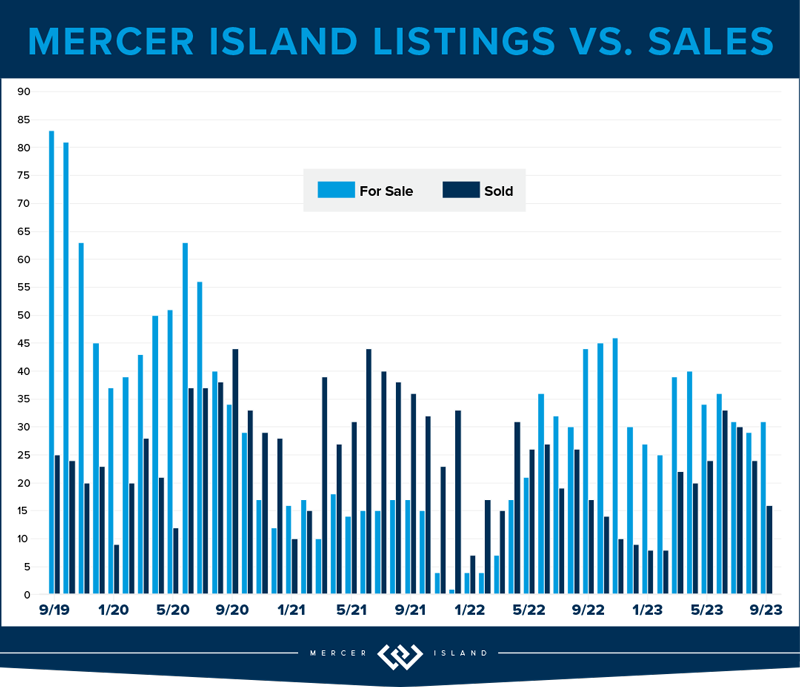
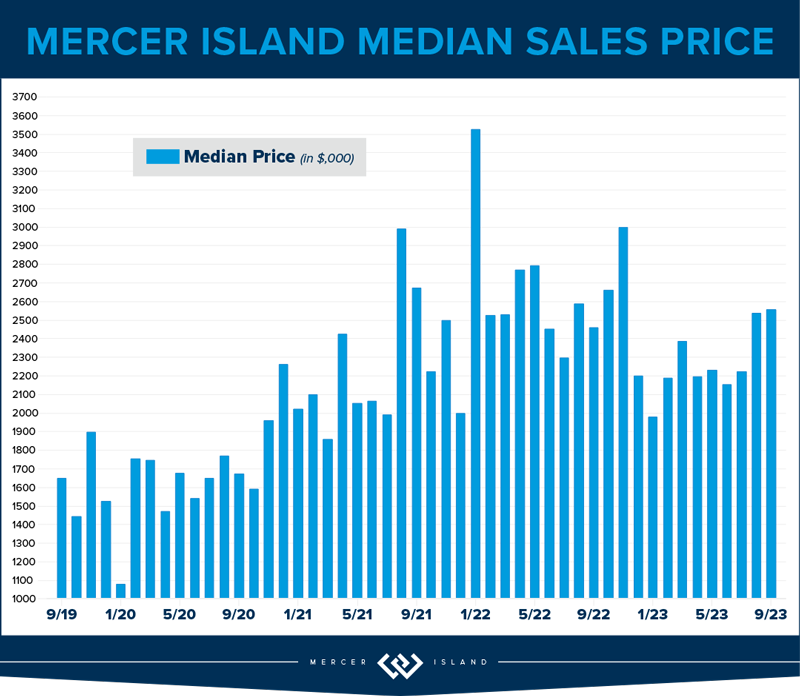
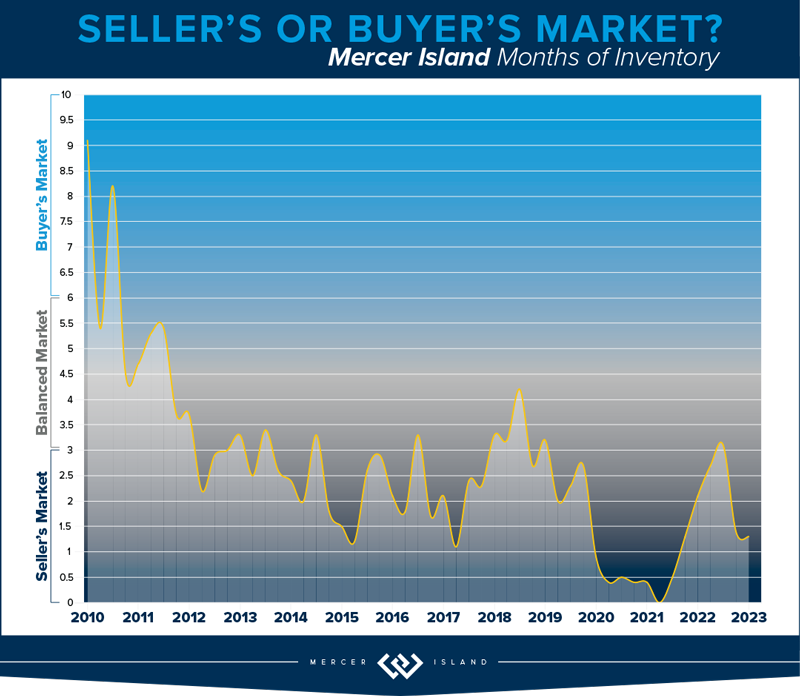
Click here for the full report and neighborhood-by-neighborhood statistics!

CONDOS – SEATTLE & EASTSIDE
The PNW condo market showed steady growth in Q3 of 2023, with year-over-year median sales prices up by 6% in both Seattle and The Eastside. Overall activity was subdued, however, with a drop in the number of new condo listings corresponding with fewer sales.
When dissecting Seattle’s condo statistics, Shoreline, Lake Forest Park and Kenmore saw the biggest price gains with a whopping 39% rise in median sales price compared to last year. Ballard and Green Lake also saw big gains with median sales price up 25%. Conversely, Shoreline experienced a stark 59% drop in sales and 40% drop in median sales prices, indicating possible shifts in buyer preferences toward the more convenient city center. While Downtown condo sales prices were also down slightly, their shimmering skylines still fetched a premium at $825 per square foot.
The Eastside condo market varied from area to area. Kirkland’s condo sales surged by 18%, with an impressive 43% increase in median sale price. Redmond also shone brightly with a 45% spike in median sale prices. Mercer Island stood out, with its 43% increase in the number of sales and 31% rise in median sale price showcasing its luxury market segment. Conversely, West Bellevue, East Bellevue, and East Lake Sammamish all posted lower year-over-year median sales prices—down -20%, -%12% and -7% respectively.
The juxtaposition of these two markets, and really the neighborhood specific swings within them, highlights the unique characteristics and demands of each, underscoring the need for prospective buyers and sellers to strategize based on specific community data. All the more reason to consult a condo pro!
Check out area-by-area details the full condo report.
WATERFRONT
Seattle once again commanded the highest number of private waterfront sales with 9 total—4 of these sold in 4 days or less, including 2 hot Beach Drive listings in West Seattle that sold above their asking prices. Lake Sammamish was close behind with 8 sales including one that sold immediately (and marked the most affordable waterfront sale at $1.62 million). Mercer Island boasted the highest waterfront sale of the quarter, a stunning North End estate on 120 feet of waterfront that went for $24.4 million. The Eastside held its own with 6 sales and the second highest sale of the quarter—$12 million—for a half-acre Yarrow Point estate on 105 feet of prime west-facing waterfront.
This brief overview of the entire Seattle-Eastside private waterfront market, including Mercer Island and Lake Sammamish, illustrates the trends occurring in our region over time. This data is interesting and insightful but cannot replace an in-depth waterfront analysis with your trusted professional.
We earn the trust and loyalty of our brokers and clients by doing real estate exceptionally well. The leader in our market, we deliver client-focused service in an authentic, collaborative, and transparent manner and with the unmatched knowledge and expertise that comes from decades of experience.
© Copyright 2023, Windermere Real Estate/Mercer Island. Information and statistics derived from Northwest Multiple Listing Service and Trendgraphix, and deemed accurate but not guaranteed. Seattle cover photo courtesy of Codi Nelson and HD Estates. Eastside cover photo courtesy of Team RAREnorthwest and Elevato Photography. Condo cover photo courtesy of Jessica Livingston and im3rd Media. Waterfront cover photo courtesy of Anni Zilz and Clarity Northwest Photography.
