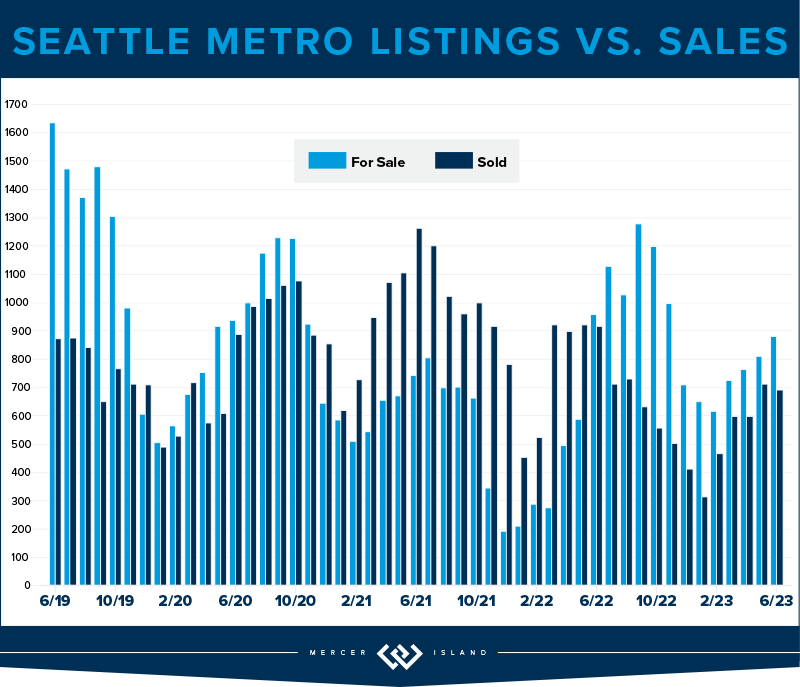
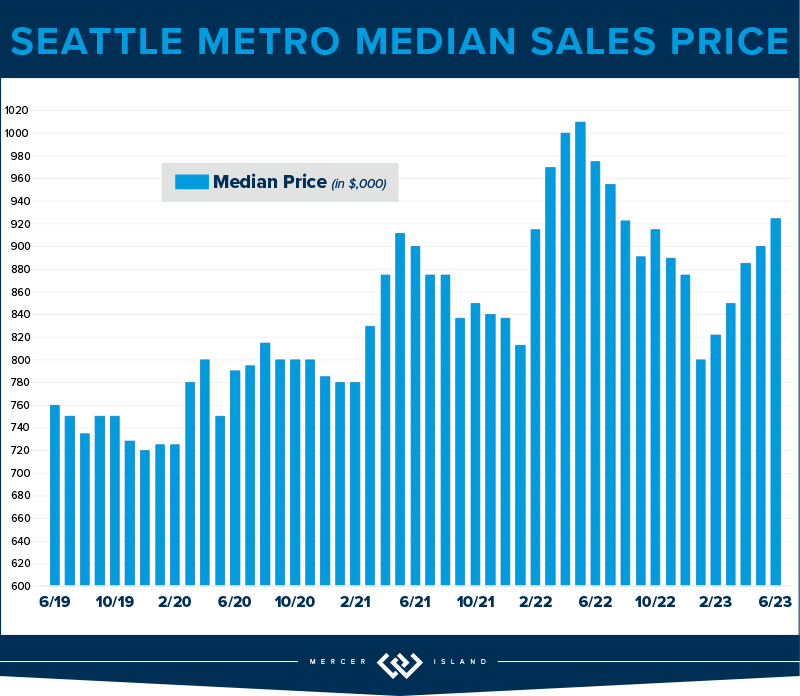
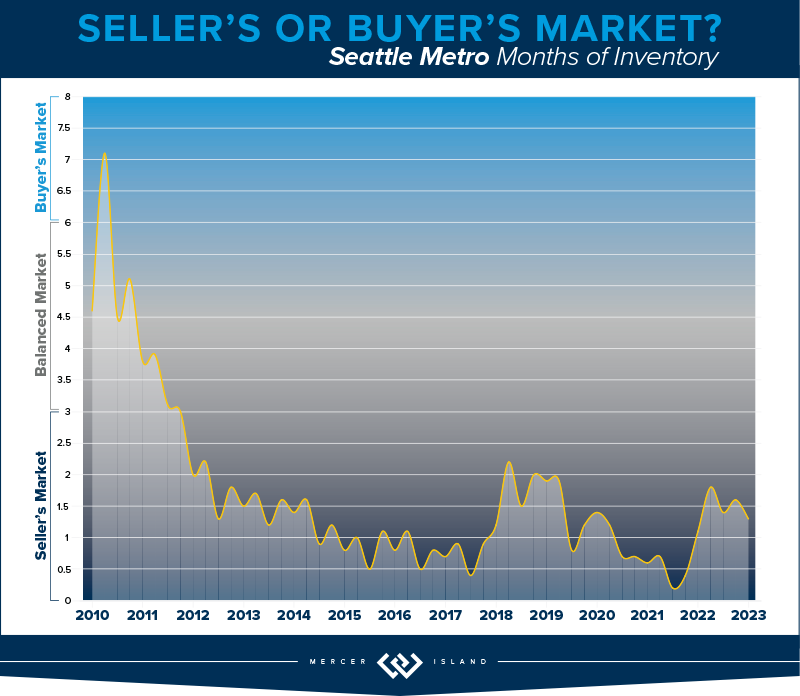
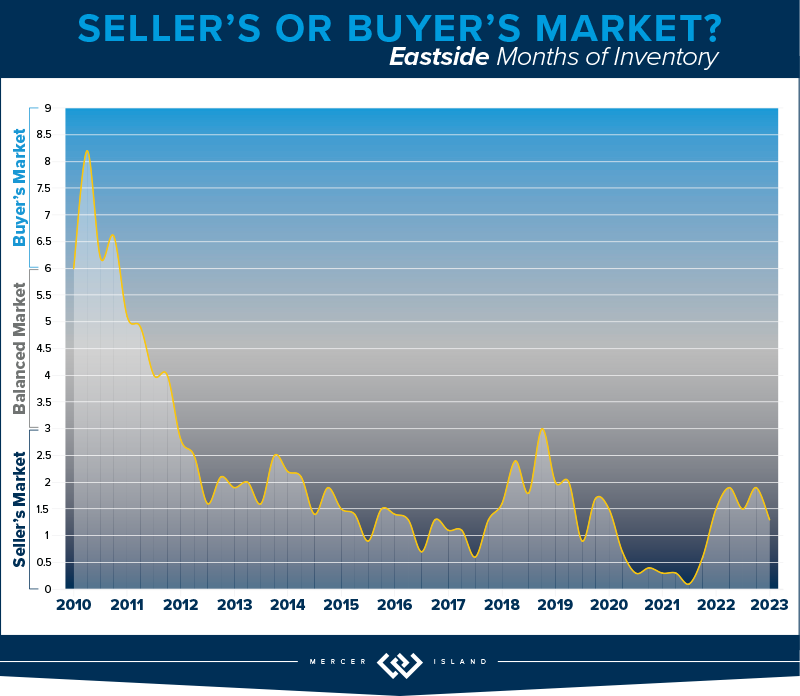
While median sales prices rose in Q2 compared to Q1, they were still down about 10% from last summer’s peak. Most areas saw fewer new listings and sales this year than we saw last year. Supply levels are still low enough to keep us technically in a seller’s market — our Windermere Chief Economist, Matthew Gardner, predicted this will continue, saying, “with relatively few homes on the market and the share of homes with price reductions dropping and list prices rising again, I just can’t see a buyer’s market appearing this year.”
Click or scroll down to find your area report:
Seattle | Eastside | Mercer Island | Condos | Waterfront
SEATTLE
The Seattle market felt a similar adjustment as the Eastside with home prices down about 10% across the board. This spring market had a 27% drop in supply which limited the overall sales. The median closed sales price of $900,000 is up from May’s $830,000, but down 10% year over year offering some relief to buyers feeling the squeeze of high interest rates.
Last quarter, we mentioned keeping an eye on North Seattle and the growth we’ve seen in Shoreline, Lake Forest Park and Kenmore likely due to transit and those seeking affordability. Interestingly, 80% of the Lake Forest Park and Kenmore homes sold at or above their list price (in comparison to Queen Anne at 62%, for example) with prices rising 14% since last quarter but down 19% year over year.
Q2 closed with 879 active residential homes on the market, but no real sense of urgency from buyers (although the average days on market was 20 compared to the Eastside’s 23 days). The presentation of a home coupled with a smart pricing strategy equates to a positive outcome for sellers — we can see this in the 42% of homes that experienced multiple offers with an average boost of 6% over list price. With that said, 26% of Seattle contracts experienced a price negotiation between parties, so if you’re a motivated buyer and write an offer, you could benefit from more traditional contract terms.
Click here for the full report and neighborhood-by-neighborhood statistics!
EASTSIDE
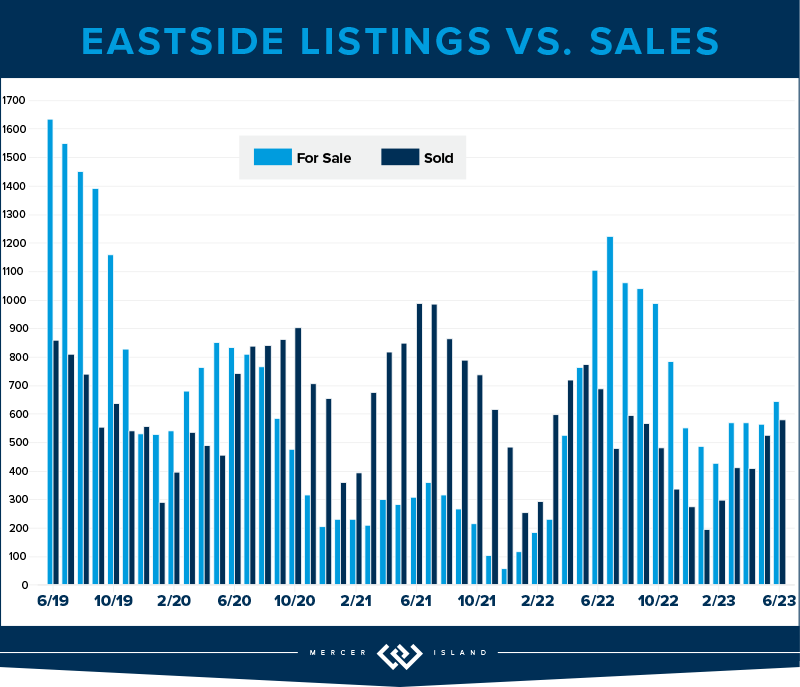
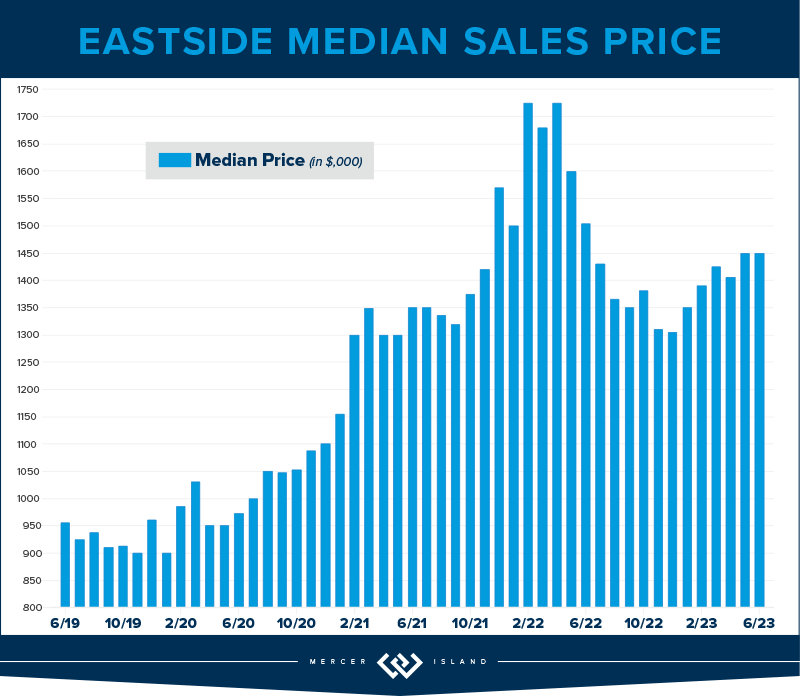
The Eastside residential market adjusted significantly this quarter. With a median price of $1,450,000 across all neighborhoods, this is an adjustment of 10% compared to last year. West Bellevue real estate, a luxury market, took the largest adjustment of 16%, down to an average of $996 per square foot. Market times were also slightly longer with 66% of homes selling within the first 10 days; the other 34% of homes had to be more patient in finding their buyer. This means that it took an average of 23 days for a seller to sell their property compared to 7 days at this time last year. However, this is much improved from 52 days in Q1!
Just like Redmond’s condos, its single family residential supply numbers were down 43%—but offered more supply than this time last year. Overall, there were 40% fewer listings than in Q2 of last year. With just 645 active homes available at the end of this quarter and rates closing out ~6.75%, low supply and high interest rates have kept sales stagnant. This time last year, there were 1,105 homes available for sale and rates had just moved across the 5% level.
It’s very true that sales are still happening and price and presentation from the seller matter most. On the Eastside, 39% of homes sold above their list price at an average of 5% over. Many buyers have adjusted their budget with the higher rates and seem motivated to get into the market now when the right home is found. If you can afford the payment, take the leap as a buyer. Sellers are motivated to accept more traditional terms, and you may not be competing amongst others.
Click here for the full report and neighborhood-by-neighborhood statistics!
MERCER ISLAND
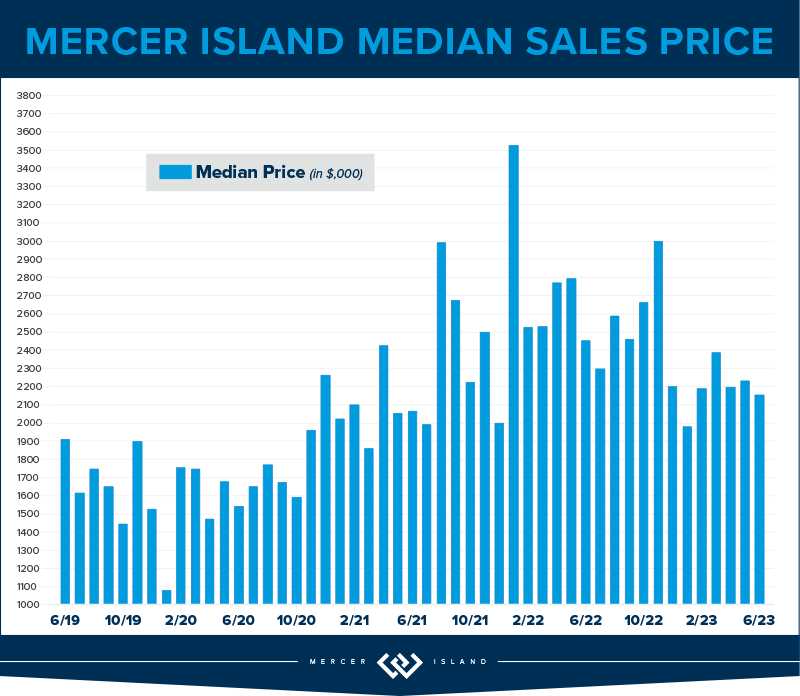
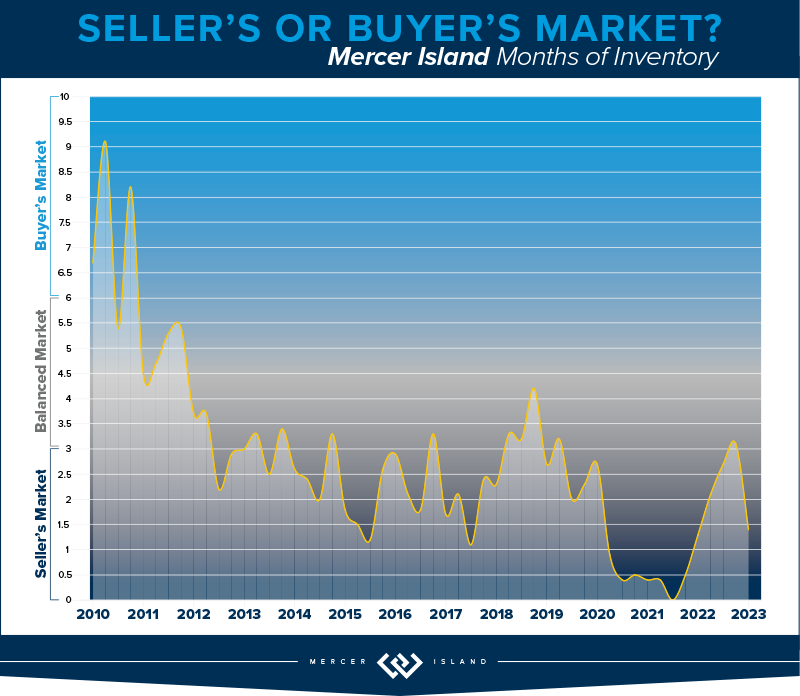
Much like other Eastside neighborhoods, Mercer Island made a significant adjustment in price—but one area of difference is that supply has remained steady. The south end offered the largest number of sold homes with 20, followed by 16 sold homes mid-island and 12 sold homes on the north end. Mid-island pricing continues to be smack in the middle with an average median sales price of $2,249,000; 75% of mid-island homes sold at or above their listing price, evidence that the desirability of being tucked away from freeway and amenities while still accessible to all is very appealing. Overall, island pricing has adjusted by 19% year over year to a median of $2.2 million compared to $2.7 million this same time last year.
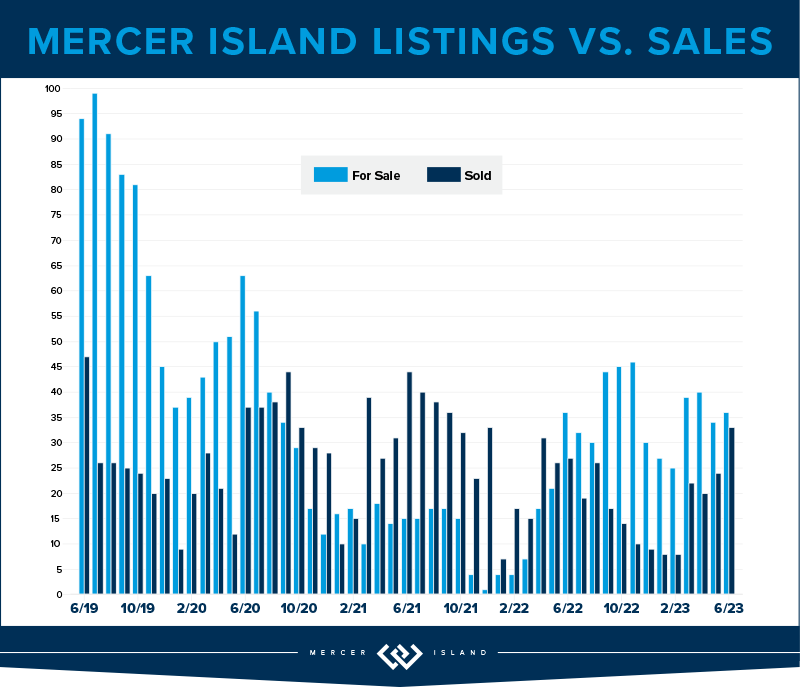
There are currently 36 active homes on the market at the end of this quarter, which is identical to our supply level Q2 last year! This is up slightly from 39 active homes at the end of last quarter. The island is also feeling the pause in demand and urgency and that’s evident in the days on market numbers. Average days on market was 31 this quarter; it only took 7 days to sell your home this time last year. The inventory of homes for sale continues to be unique and striking, and a great pricing strategy equates to both happy seller and happy buyer.
Click here for the full report and neighborhood-by-neighborhood statistics!
CONDOS – SEATTLE & EASTSIDE
For first time homebuyers, condos are still a fantastic starter purchase, whether you want to invest, live in the city or in a more suburban environment. We didn’t experience the same urgency with condo buyers this Spring likely because of interest rates, the fear of tech layoffs, or the transition from remote work to office work.
Year over year, neighborhoods like West Seattle, North Seattle, Queen Anne and Ballard saw strong price gains while South Seattle and Capitol Hill took a 20% median price adjustment. While it’s tough to find a direct correlation for neighborhoods tracking significantly different than others, the price gains are likely due to supply issues in these popular neighborhoods. On the flip side, price adjustments could be a sign that sellers had higher expectations of price before correcting to a normal level with a reduction or negotiation. There were 565 units available at the close of the quarter, down from 605 active units at the close of Q2 last year. Sellers are likely staying put for now, or they are investors with a low interest rate mortgage. Lake Forest Park and Shoreline condos triumphed over others with 81 percent of the 16 total condos selling at or above their list price; 70% of these units sold within the first week.
On the eastside, East Bellevue and East of Lake Sammamish had rising median prices with an average increase of 6% year over year, while other eastside neighborhoods adjusted downward. Redmond condo supply was down 41 percent! Again, this number reflects sellers staying put and with current interest rates hovering around 6.5% today, there may not be a suitable option for them to consider “trading up” to a larger unit or a single family home. With lack of supply and high rates, total sales are stagnant.
Check out area-by-area details the full condo report.
WATERFRONT
Most of the waterfront sales this quarter happened in Seattle with 14 sold homes compared to 6 sold homes last quarter. Just two Mercer Island waterfront properties, located on the north end, sold this quarter (the same number of sales as last quarter!)—one with significant competition, selling $750,000 above its listing price in just four days. While there were just seven Eastside sales (also the same number of sold homes as Q1 this year), four of those homes sold in five days or less including a $14m waterfront property on Hunts Point.
This brief overview of the entire Seattle-Eastside private waterfront market, including Mercer Island and Lake Sammamish, illustrates the trends occurring in our region over time. This data is interesting and insightful but cannot replace an in-depth waterfront analysis with your trusted professional.

© Copyright 2023, Windermere Real Estate/Mercer Island. Information and statistics derived from Northwest Multiple Listing Service and Trendgraphix, and deemed accurate but not guaranteed. Mercer Island cover photo courtesy of Cynthia Schoonmaker and Clarity Northwest Photography. Eastside cover photo courtesy of Joe Liu and Clarity Northwest Photography. Condo cover photo courtesy of Team RAREnorthwest and Elevato Photography.

 Facebook
 X
X
 Pinterest
 Copy Link

