 Facebook
 X
X
 Pinterest
 Copy Link
Planning Ahead: A 12-Month Guide to Buying Your First Home

Thinking about buying a home can be daunting, especially if it’s your first time. What should be an exciting milestone can feel overwhelming without a clearly defined roadmap, and diving in headfirst without a solid plan can lead to unnecessary stress, financial surprises, and missed opportunities. However, by establishing a timeline and breaking the process down into manageable steps, you can move forward with confidence and clarity.
Here is your month-by-month guide to preparing for a successful home purchase in the following year.
12 – 10 MONTHS OUT
Know Your “Why”
Understand your motivation for buying. Are you relocating, growing your household, or ready to invest in your future? Clearly defining your “why” will help shape your search criteria and influence your budget, location, and timeline.
Set Clear Goals
Start to think about what you want in your new home. Create a list of your wants versus must-haves, including location, budget, size, and style of home. These goals will act as a compass throughout your search. Be sure to include your ideal timeline and what you hope to get out of the overall experience.
Find an Agent Who Prioritizes Your Goals and Timeline
A trusted real estate agent is more than just a facilitator; they’re a guide, negotiator, and advocate. Look for someone who understands your timeline and long-term vision and is familiar with the local market. Ask them to provide a first-time buyer’s guide or checklist to help you get started. Building this relationship early allows your agent to understand your needs and preferences in advance, setting the stage for a smoother process when you’re ready to make your move.
9 – 7 MONTHS OUT
Assess Your Finances
Take a close look at your income, debt, and spending habits. Use this time to create a monthly budget that includes future mortgage payments, utilities, insurance, taxes, and home maintenance. Many experts recommend spending no more than 28% of your gross monthly income on housing costs.
Boost Your Credit
Your credit score has a significant impact on your buying power, including your mortgage rate and loan approval. Take the next few months to pay down high-interest debt, stay current on all payments, and avoid opening new credit accounts. Check your credit report for errors and work on improving your score if needed.
Start Saving
You’ll want to have enough set aside not only for a down payment, which is typically 3% to 20% of the purchase price, but also for closing costs, moving expenses, and initial home repairs or furnishings. During this time, try to avoid nonessential major purchases and think about setting up a dedicated home savings account to stay consistent.
6 – 4 MONTHS OUT
Talk to a Financial Advisor
A financial advisor can help you align your financial goals with your homebuying plans. They can offer advice on what you can realistically afford and help identify areas to strengthen your financial readiness. You can also use tools like an online mortgage calculator to get a clearer idea of what your future monthly payments might look like.
Research Homebuyer’s Courses & Guides
Take advantage of first-time homebuyer resources, guides, and online courses. The more you know earlier on, the more confident you’ll feel.
3 – 2 MONTHS OUT
Familiarize Yourself with the Market
Start browsing homes and monitoring prices in the neighborhoods you’re interested in. Learn whether your local market is currently favoring buyers or sellers and what that could mean for your strategy.
Meet with a Lender and Get Pre-Approved
Meeting with a lender and getting pre-approved can help give you a clear picture of how much you can borrow and what price range to shop within. It also shows sellers that you’re a serious buyer when the time comes to make an offer. Your realtor can recommend trusted lenders to work with and assist you through this process.
Start Your Home Search
Now that you have your list of wants and needs and know your price range, you’re ready to start searching for your dream home. Use online property research tools to filter by location, features, and price to see what’s available in the locations you like. Narrow down your top homes and start scheduling showings and comparing listings.
1 MONTH OUT
Make an Offer
Once you find “the one,” your agent will help you craft a competitive offer, negotiate terms, and guide you through contingencies.
Get a Home Inspection
If your offer is accepted, a licensed inspector will identify any issues with the property before you finalize your purchase. Depending on what comes up, this can give you leverage to negotiate repairs or price adjustments.
THE TIME HAS COME
Closing On Your New Home
You’ve made it! During closing, you’ll sign paperwork, pay final costs, and receive the keys to your new home. Your agent and lender will walk you through the final steps to ensure everything goes smoothly.
Buying a home may seem like a big leap, but with a solid 12-month plan and the right support, it can be an extremely rewarding experience. Take it one step at a time and know that I’m here to help whenever you’re ready.

This article originally appeared on the Windermere Blog

We earn the trust and loyalty of our brokers and clients by doing real estate exceptionally well. The leader in our market, we deliver client-focused service in an authentic, collaborative, and transparent manner and with the unmatched knowledge and expertise that comes from decades of experience.
© Copyright 2026, Windermere Real Estate/Mercer Island.
How’s the Market? Q1 2026 Review of Seattle Area Real Estate

Across the region, median sales prices were lower than we saw at this time last year. The likely cause: more homes are hitting the market, but buyers (rattled by rising rates, layoffs, and an uncertain economy) aren’t keeping pace. That being said, we are still seeing many homes sell in their first 10 days on market with the choicest homes drawing multiple offers and selling above the asking price. The market is complex and every home is different…part of my job is to look beyond the averages to get a clearer understanding of what is happening at the neighborhood level.
Despite the push in interest rates, it continues to be a good time to invest and find the right home! Buyers who are up-sizing have a special advantage when prices dip since the money they save on their purchase often exceeds the lower ROI from their sale.
Click or scroll down to find your area report:
Seattle | Eastside | Mercer Island | Condos | Waterfront
SEATTLE
When you look past the overall data, Seattle real estate is firing on all cylinders. Even though the median price is down YOY from $958,000 in 2025 to today’s $920,000 the actual median price point is hot, in city. We’re hearing tales of multiple offers in the $800,000-$1,200,000 price range from all corners of the core Seattle neighborhoods. 67% of homes sold for at or above list price, those that sold above sold for 104% (median) over list! The entire market average list to sales price is 101%, which bodes well for gains YOY in Q2.
West Seattle and Madison Park seem to be carrying the market, the only two neighborhoods to post stable or even a modest gain in price. Maybe not so ironically, Shoreline and Lake Forest Park saw among the highest gain in overall sales volume but also the biggest losses in median price at 10%. Shoppers are savvy and know when they’ve found a deal.
While our market is facing existential pressure from things like rising interest rates, war, and talks of recession; the city hasn’t looked this beautiful in years as officials prepare for World Cup festivities in a few months. There is always a bright side, and homebuyers appear to be seeing the silver lining as they consider their long-term investment plans. If you’ve thought about selling your home in 2026, we think this could be a great year: sales are happening, 55% within the first 10 days.
Click here for the full report and neighborhood-by-neighborhood statistics!

EASTSIDE
While median prices across the Eastside fell from $1,678,000 in Q1 2025 to $1,520,000, this quarter there are still bright spots. Namely, West Bellevue whose median price jumped 23% YOY. Though while the total number of sales were up in nearly every Eastside city, West Bellevue’s 36% dip drug the market down to report flat total sales: 966 at the end of Q1 2026 compared to 969 in the same period last year.
Mercer Island reported a region-wide high gain in average price per square foot at 14%, and West Bellevue was not far behind at 2%. All other neighborhoods had dips, topped by Redmond which fell 10%.
New listings rose 20% YOY, and this could mean many things but we think the two most likely are: home sellers got a head start in 2026 (we predict fewer new listings in Q2 than last year when new inventory nearly doubled from one quarter to the next) OR everyone else is as bullish about the market as we are. List to sales price ratios are at 99% on average and 51% of homes sold in the first 10 days. If you find the right home, don’t be afraid to jump.
Click here for the full report and neighborhood-by-neighborhood statistics!

MERCER ISLAND
Island real estate seems to be off to a slow start in 2026 with median prices slipping YOY from $2,937,000 in 2025 to $2,370,000 in 2026. This is likely due to a spike in the months of inventory: 4.7 up from 2.9 last Q1. The months of inventory is a barometer for which way prices trend. High inventory = falling prices, supply/demand. That said, 60% of all homes sold for at or above list price and 63% sold in the first 10 days. Both of these numbers are indicators that homeowners are pricing to sell.
The condo market appears to be healthy this spring. Even though there are only 8 total sales that number is up a whopping 60% YOY. Median price is down 33%, but this is a rounding error with only 8 data points this year and 5 last year. A better indicator of market health is a 2.2 months supply of inventory, which is outpacing pretty much any segment of the market!
While our market is facing existential pressure from things like rising interest rates, war, and talks of recession; Mercer Island is now the “Bridge” in a whole new way with light rail open from Seattle to the Eastside. It will be interesting to see how this fun change affects the market as a whole.
Click here for the full report and neighborhood-by-neighborhood statistics!
CONDOS – SEATTLE & EASTSIDE
Seattle condo sales are up 8% over Q4 2025, an incredible seasonal boost. Though, the median price is down 6% YOY to $596,000. 25% of listed condos sold in the first 10 days and 48% of all condos sold for at or above list price. This tells us that agents and homeowners are tuned in to what a homebuyer in today’s market expects.
On the Eastside it’s a very similar story. Inventory is at 5.1 months. Meaning: at the current pace of sales, if no new listings came on the market, it would take nearly half a year to sell through the current inventory. That’s the highest since before 2020, the six year low was Q4 of 2021. Prices seem to reflect this, with an 11% dip in median home price down to $655,000 from Q1 2025: $740,000.
If you’ve thought about selling your condo in 2026, prepare for a highly saturated market where you’ll need to whip your unit into tip-top shape and price competitively to attract buyers. Inventory is up a combined 5%, while sales are down 21%. This is a big gap that will definitely create downward pressure on pricing if the gap between demand and supply widens. If you have the luxury to wait and watch, that might be your best option. If you’ve thought about buying, this is an excellent year to consider your options. Just remember, if you find the right nest and it hasn’t been on the market long: jump in! The good ones don’t last.
Check out area-by-area details in the full condo report.
WATERFRONT
Seattle and the Eastside both had fewer waterfront sales this quarter than we saw in Q1 of 2025, whereas Lake Sammamish posted the same number of sales and Mercer Island saw a boost. The vast majority of homes sold at or below their listed prices with the exception of one mid-century Magnolia home on 75 feet of waterfront that garnered over $300k above and beyond its original asking price.
The highest sale was in Hunts Point at $17+ million for a stunningly reimagined English Tudor on 3/4-acre with extensive waterfront. The most modest sale was in Rainier Beach: an original 1980 home on 50 feet of waterfront that went for $1,640,000.
This brief overview of the entire Seattle-Eastside private waterfront market, including Mercer Island and Lake Sammamish, illustrates the trends occurring in our region over time. This data is interesting and insightful but cannot replace an in-depth waterfront analysis with your trusted professional.
View the full waterfront report

We earn the trust and loyalty of our brokers and clients by doing real estate exceptionally well. The leader in our market, we deliver client-focused service in an authentic, collaborative, and transparent manner and with the unmatched knowledge and expertise that comes from decades of experience.
© Copyright 2026, Windermere Real Estate/Mercer Island. Information and statistics derived from Northwest Multiple Listing Service and Trendgraphix, and deemed accurate but not guaranteed.
Seattle report cover photo courtesy of The Sirianni Group; and Andrew Webb, Clarity NW Photography.
Eastside report cover photo courtesy of Tori Franzen; and Michael Tilzer Photography.
Mercer Island report cover photo courtesy of Julie Wilson; and Chris Neir, Clarity NW Photography.
Condo report cover photo courtesy of Marianne Parks; and Christopher Cooper, Clarity NW Photography.
The Pitfalls of Overpricing Your Home

When a homeowner prepares to put their house up for sale, two things are usually top of mind: how long will it take to sell and how much can we get for it. During a seller’s market, when stories of bidding wars and cash offers abound, it can be tempting to put as high a price tag on your home as possible. But even when the market favors sellers, overpricing your home can jeopardize your efforts to sell quickly and get top dollar.
Missing Your Market
The vast majority of homebuyers start their search online, and the first criteria they often enter is the price range. If your home is above the high point of their range, buyers in your target market will never even see your listing—it simply won’t show up in their searches. In addition, it’s human nature to go after the top item in a collection. Buyers want the most house they can get within their budget. This means you want to be the best house compared to those in your price range, rather than among the bottom compared to those in a more expensive bracket.
Key takeaway: You want to shine against your competition, not pale by comparison
Playing the Numbers
Selling a home is a numbers game: the more potential buyers, the greater chance of an offer. Overpriced homes get fewer showings, both in person and online. Your agent will tell you that showings are critical to capturing the interest of buyers, but if the home is overpriced, they will have difficulty attracting attention to your home. This can slow the entire home selling process, leaving both you and your agent feeling frustrated.
Key takeaway: More showings = more offers.
Going Stale
It’s also human nature to be drawn to what’s new, the bright, shiny object, as the saying goes. New listings attract the most attention—that’s when buyer interest is highest. The longer your home is on the market, the less appealing it becomes. And at a certain point, you may be forced to lower the price. Many buyers and their agents will assume the reason the house has been on the market so long, and why you had to lower the price, is because there is something wrong with it. Once the price drops begin, they can continue, which creates the risk of selling your home for less than what it is worth.
In addition, the longer your home is on the market, the more expenses you incur. Mortgage payments, utilities costs, and seller’s fees will continue to pile up, making it harder to recover from these costs when your home does eventually sell.
Key takeaway: Be the bright, shiny object.
Losing at the Last Minute
Let’s say you do find a buyer at the overpriced cost. During closing, the lender will order an appraisal of your home. If the appraiser finds that the market value of the home is less than the selling price, they could deny financing. If that happens and you are forced to put the house back on the market, buyers’ agents will be able to see that it’s a relisting, could assume something is wrong with the house and share those concerns with their client.
Key takeaway: Be realistic about value.
Want an accurate idea of your home’s value in the current market? I can provide you with a Competitive Market Analysis (CMA). Unlike automated home value calculators, I take into account recent market trends, unique home features, competing properties, and your home’s overall marketability.

Adapted from an article that originally appeared on the Windermere blog August 5th, 2024.
We earn the trust and loyalty of our brokers and clients by doing real estate exceptionally well. The leader in our market, we deliver client-focused service in an authentic, collaborative, and transparent manner and with the unmatched knowledge and expertise that comes from decades of experience.
© Copyright 2026, Windermere Real Estate/Mercer Island.
Strategic Investments to Boost Value & Curb Appeal

When it’s time to sell your home, one of the biggest questions is how to make it as appealing as possible to today’s buyers. While market conditions, location, and timing all play a role, the updates you choose before listing can make a meaningful difference in both your selling price and how quickly your home goes under contract. The key is knowing where to invest your time and money. Not every project pays off, but some smart upgrades can give your home a competitive edge, help it stand out in online listings, and create the kind of first impression that gets buyers excited.
Here are some of the most impactful ways to invest in your home before putting it on the market.
Fresh Paint and a Neutral Palette
Few improvements have a more substantial return on investment than paint. A fresh coat instantly refreshes a space, making it feel clean, updated, and well-maintained. In fact, a recent report1 by the National Association of REALTORS® found that painting is the #1 project agents recommend sellers do before selling.
Neutral tones for interiors, such as light beige, soft grays, and crisp whites, appeal to the broadest audience and allow buyers to envision their own style in the home. Check out the Sherwin-Williams Colormix Forecast 2026 for some up and coming hues (and opt for the lightest shades). It’s crucial not to overlook trim, doors, and even ceilings, as these small details help create a polished, move-in-ready feel. And if your front door could use a pop of personality, consider a bold, welcoming color that complements the rest of the exterior.
Curb Appeal That Counts
Buyers often form an impression before they even step inside. Landscaping, exterior lighting, and simple maintenance go a long way toward making your home inviting. Think trimmed hedges, fresh mulch, pressure-washed walkways, and a tidy lawn. It’s also smart to ensure outdoor areas are safe, from repairing uneven paths to addressing any obvious hazards. Here is a printable checklist so you don’t miss anything.
Adding planters with seasonal flowers, updating house numbers, or swapping out an old mailbox can elevate your home’s appearance without requiring a significant investment. For buyers scrolling through listings, that curbside charm can be a deciding factor that gets them to schedule a showing.
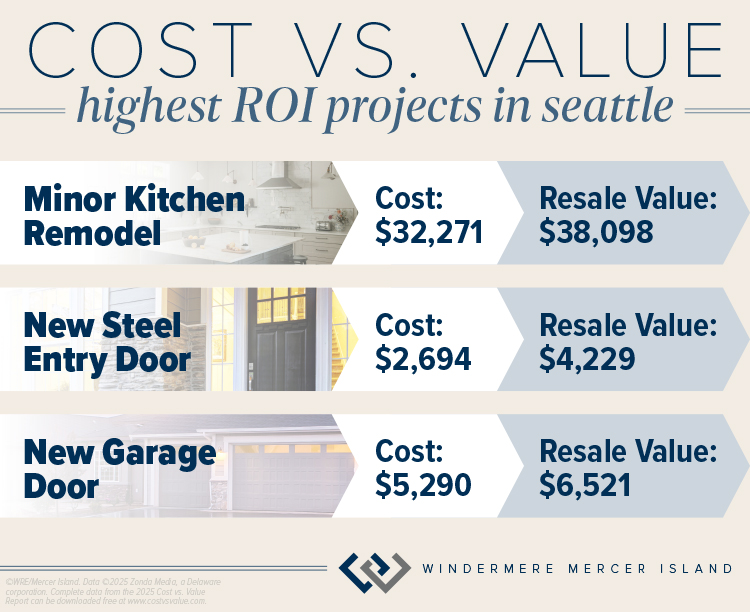
According to the latest Cost vs. Value report for Seattle2, exterior curb appeal investments such as a basic new front door or garage doors can net you a profit when it’s time to sell:
Kitchen and Bathroom Touch-Ups
Kitchens and bathrooms continue to be high priorities for buyers, but you don’t need to take on a full remodel to make an impact. Small upgrades like replacing outdated cabinet hardware, installing new light fixtures, or swapping in modern faucets can transform the look of these spaces.
In the kitchen, consider updating your backsplash with a clean, timeless tile or refreshing worn countertops with a durable surface. In bathrooms, re-grouting tile, caulking any cracks, replacing mirrors, or updating vanities are simple ways to modernize without overspending.
The Cost vs. Value report2 also found that the kitchen can be a smart place to invest in a minor remodel of surfaces and newer mid-priced appliances and fixtures. In the Seattle area, a minor remodel is estimated to recoup 118% of its cost when you sell.
Flooring Matters
Floors are often one of the first things buyers notice when touring a home. If your carpets are worn or stained, professional cleaning or even replacement can make a big difference. Hardwood floors are especially appealing and refinishing them is often more cost-effective than replacing them.
For areas where replacement makes the most sense, consider durable and stylish options like engineered wood or luxury vinyl plank. Consistent flooring throughout the main living areas can also help a home feel more spacious and cohesive.
Energy-Efficient Features
Today’s buyers are increasingly focused on efficiency and sustainability. Investments like LED lighting, programmable thermostats, and updated appliances not only lower utility bills but also signal to buyers that the home is modern and thoughtfully maintained.
If your budget allows, new windows or improved insulation can add value while appealing to environmentally conscious buyers. Highlighting these upgrades in your listing helps showcase both comfort and cost savings.
Decluttering and Staging
Sometimes the most impactful upgrade isn’t about new finishes, it’s about presentation. Decluttering each room, minimizing personal items, and rearranging furniture to optimize space can dramatically change how buyers perceive your home. Here’s a printable checklist to help. And the best part? It’s completely free.
Professional staging takes this one step further, creating a warm and welcoming atmosphere that helps buyers envision living in the space—it can also help your home sell faster and for more money according to a 2025 report3. Even small touches, like fresh flowers, cozy throws, and well-placed artwork, can make your home feel more stylish, comfortable, and truly move-in ready.
Making Smart Choices
The goal of any pre-sale investment is to spend strategically, choosing projects that increase appeal without overextending your budget. You can also refer to this article on what NOT to do.
As a Windermere agent, I’m an expert at helping sellers decide which upgrades matter most. From recommending paint colors to connecting you with trusted contractors, I’m here to make sure you get the best return on your investment. Through our Windermere Ready program, we can even front the cost of improvements like painting, landscaping, cleaning, and staging so your home shines its brightest when it hits the market. With concierge-level service and no payments due until closing, it’s a simple way to maximize your home’s value and sell faster.
Connect with me today to learn more about how I can help you prepare your home for the market with confidence:

Adapted from an article that originally appeared on the Windermere blog October 1, 2025.
1Copyright ©2025 “2025 Remodeling Impact Report.” NATIONAL ASSOCIATION OF REALTORS®. All rights reserved. April 9, 2025, https://www.nar.realtor/sites/default/files/2025-04/2025-remodeling-impact-report_04-09-2025.pdf.
2©2025 Zonda Media, a Delaware corporation. Complete data from the 2025 Cost vs. Value Report can be downloaded free at www.costvsvalue.com.
We earn the trust and loyalty of our brokers and clients by doing real estate exceptionally well. The leader in our market, we deliver client-focused service in an authentic, collaborative, and transparent manner and with the unmatched knowledge and expertise that comes from decades of experience.
© Copyright 2026, Windermere Real Estate/Mercer Island.
How’s the Market? Year End Review of Seattle Area Real Estate in 2025

Home values held steady in 2025 with many communities seeing modest price gains. Seattle Metro’s median sale price and $ per sq. ft. both rose year-over-year, while the Eastside’s numbers remained similar to what we saw in 2024. Both areas saw double-digit spikes in the number of new listings and a slight slowdown in the number of sales.
Looking forward: this is a great year to invest! We’ve had a few back-to-back years of soft price gains, which feel like losses in our frequently HOT Seattle. This is as close to a “buyer’s advantage” market as we’ve seen in years. At the time of writing this, interest rates are available in the high 5’s. The cost of money is reasonable and the cost of property has not risen drastically in a few years. This is the perfect time to jump in for investors and first-time buyers. More specifically, anyone who can buy “unburdened” or without having to sell/carry two mortgages in order to buy. The condo and townhome markets continue to be a great opportunity for those looking to take the first step onto the property ladder. If none of this applies to you, remember: if you’re looking to buy and sell within the same market, you only get an advantage on one side.
Click or scroll down to find your area report:
Seattle | Eastside | Mercer Island | Condos | Waterfront
SEATTLE
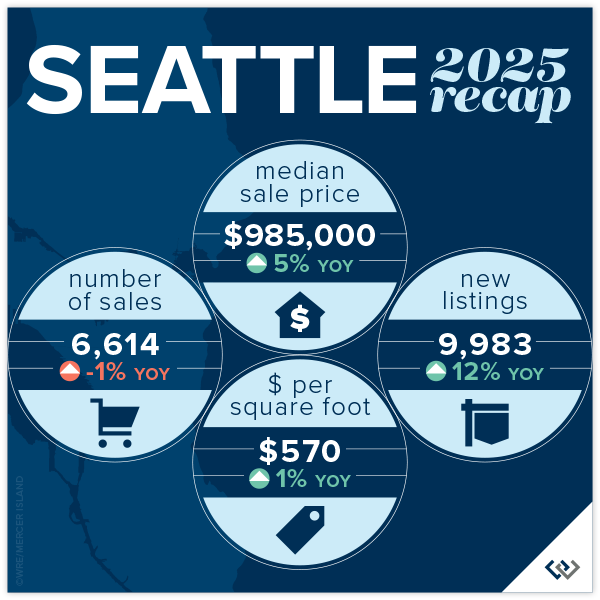
It’s all good news in the city of Seattle! The median price rose by 5% to $985,000. Pricing remained competitive, with 64% of homes selling at or above their list price (despite the fact that new listings increased 12% from 2024 and the number of sales dipped slightly).
Sales activity moved quickly in many neighborhoods. Citywide, 55% of homes sold within the first 10 days on market. Several areas posted strong performance, including Ballard & Green Lake with 1,705 homes sold, and North Seattle with 1,040 sales. Median prices varied by neighborhood, ranging from $794,000 in South Seattle to $1,399,000 in Queen Anne & Magnolia, reflecting the diversity of Seattle’s housing market.
Remember, these statistics include new construction data. In an inventory-constricted market, new construction data can skew pricing stats significantly. Check with your agent for how this affects your neighborhood.
Click here for the full report and neighborhood-by-neighborhood statistics!

EASTSIDE
Across the Greater Eastside, 5,458 homes sold during the year, down 5% compared to 2024. New inventory increased, with 8,259 new listings coming to market—up 16%! Fifty-five percent of homes sold at or above their list price, and 53% sold within the first 10 days on market, highlighting consistent transaction pace and buyer confidence across the region. Despite this, the median sale price held flat at $1,599,000 compared to 2024, while homes sold for an average of $688 per square foot, also similar to last year.
Several communities recorded notable activity levels, including Woodinville with 1,235 homes sold and East of Lake Sammamish with 1,134 sales. East Bellevue saw a 13% increase in homes sold, while Redmond posted a 15% increase in sales volume. Median sale prices varied by community, ranging from $1,281,000 in Woodinville to $3,688,000 in West Bellevue, reflecting the diversity of the Eastside housing market.
Several communities recorded notable activity levels, including Woodinville with 1,235 homes sold and East of Lake Sammamish with 1,134 sales. East Bellevue saw a 13% increase in homes sold, while Redmond posted a 15% increase in sales volume. Median sale prices varied by community, ranging from $1,281,000 in Woodinville to $3,688,000 in West Bellevue, reflecting the diversity of the Eastside housing market.

Click here for the full report and neighborhood-by-neighborhood statistics!
MERCER ISLAND
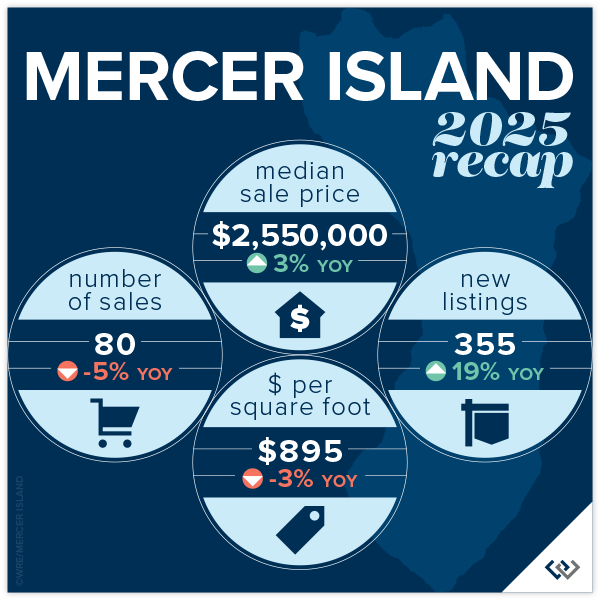
The 2025 Mercer Island real estate data reflects a year of steady activity and modest price gains. Median home prices rose 3% year over year to $2,550,000. Homes sold for an average of $895 per square foot, and half of all homes sold at or above their list price. Sales moved efficiently, with 56% of homes selling within the first 10 days on market.
A total of 80 single-family homes sold on Mercer Island during the year. Activity varied by neighborhood, with sales recorded across Northend, Southend, Mid-Island, First Hill, Westside, and The Lakes. Median home prices ranged from $1,775,000 in Mercerdale to $5,831,000 on the Westside, highlighting the range of housing options across the island.
Click here for the full report and neighborhood-by-neighborhood statistics!

CONDOS – SEATTLE & EASTSIDE
The 2025 Condo Report shows steady, encouraging activity across both the Seattle and Eastside condo markets. Year over year, condo sale prices increased a combined 2% to a median of $630,000, with homes selling for an average of $633/sq.ft. Half of all condos sold at or above their list price, signaling stable buyer demand. Inventory also expanded, with 8,331 new condo listings—up 14% from 2024! This is great news, increased supply that didn’t cause a price ‘dump’, it shows our Buyers may be returning to confidence around condos.
In Seattle, 2,695 condos sold during the year, a 9% increase in sales volume. The median Seattle condo price rose 2% to $585,000, and 51% of homes sold at or above list price. On the Eastside, 2,050 condos sold, with median prices increasing 5% year over year to $730,000. Eastside condos averaged $643 per square foot, with 51% selling at or above list price and 36% selling within the first 10 days. The market showed a combined 52 average days on market, with a 99% list to sales price ratio. Though, when original list to sales price ratio is compared the average sits at 97%. This means that patience and active calibration are both required when marketing your condo.
Mercer Island’s condo market also trucked along with 27 sales and a slight 1% year-over-year boost in median prices. Condos sold for an average of $591 per square foot, up 13% over 2024. Thirty-seven percent of condos sold at or above list price, and within the first 10 days. Inventory expanded as well, with 355 new condo listings, up 19% from 2024.
Check out area-by-area details in the full condo report.

WATERFRONT
Seattle saw a boost in the number of waterfront sales in 2025, with 36 compared to 31 in 2024. Lake Sammamish sales were similar to last year (31 vs. 30 in 2024), while Mercer Island and the Eastside both saw slight dips their sales numbers.
Mercer Island had the highest waterfront sale of the year at $25 million for a nearly 10,000 sq. ft. European Modern home on 102 feet of prime west-facing North End waterfront. The most modest sale was in Bellevue at $1.75 million for an original 1960s beach house on 50 feet of lakefront.
This brief overview of the entire Seattle-Eastside private waterfront market, including Mercer Island and Lake Sammamish, illustrates the trends occurring in our region over time. This data is interesting and insightful but cannot replace an in-depth waterfront analysis with your trusted professional.
View the full waterfront report

We earn the trust and loyalty of our brokers and clients by doing real estate exceptionally well. The leader in our market, we deliver client-focused service in an authentic, collaborative, and transparent manner and with the unmatched knowledge and expertise that comes from decades of experience.
© Copyright 2026, Windermere Real Estate/Mercer Island. Information and statistics derived from Northwest Multiple Listing Service and Trendgraphix, and deemed accurate but not guaranteed.
Renting vs Buying: Which is Better for You?

Knowing whether it’s the right time to rent or buy depends on your buying power, what you’re looking for in a home, your local market conditions, your plans for you and your household, and the responsibilities you’re prepared to take on at your residence.
Renting gives you greater flexibility to relocate, fewer home maintenance responsibilities, and can often be more the more affordable option, depending on where you live. The extra costs associated with owning a home—interest payments, taxes, repairs—may be too much for some renters to handle.
Becoming a homeowner also has its advantages. From a financial standpoint, owning is usually better than renting in the long term—it allows you to build wealth as your property gains equity; your monthly payments are stable and actually become more affordable over time relative to your income; and some of the costs may be deductible at tax time. From a lifestyle standpoint, owning also affords you greater freedom to customize your living space.
Ultimately, the right decision depends on your situation. If you don’t plan to be living in the same place for at least five years, renting might be more logical, as it allows you more flexibility when it comes time to move again. If you’re looking to settle down for the better part of a decade or longer and can afford to buy a home, becoming a homeowner may be the better option. Here are a few additional considerations to guide your renting-versus-buying decision making process.
What are the local real estate market conditions?
Investigate the local sales and rental markets to get an idea of both typical home prices and the average monthly payment for a rental. When comparing housing costs, be sure to base your evaluation on what’s happening in your city and neighborhood, not the nationwide averages. I track these stats regularly, so feel free to contact me for an accurate update on prices in your neighborhood.
For a quarterly breakdown of local market conditions in the Seattle area, explore my Market Review page. Each report breaks down the latest figures in home sales, home prices, and days on market for regions throughout Seattle and the Eastside. They also include helpful insights and data analysis.
What can you afford?
Making the jump from renter to homeowner is often a question of affordability. Your mortgage rate will depend on your financial strength, your credit score, and other factors, so make sure to talk to a loan officer before you start looking for a home. Getting pre-approved for a mortgage will identify what you’re able to afford and helps strengthen your offer when the time comes.
To get an idea of what you can afford, try these Financial Calculators. You can estimate your monthly payment for any listing price/mortgage terms to get a well-informed picture of whether it’s the right time to buy.

Will you need to make repairs to your new home?
Buying a fixer-upper may seem like a great way to get a deal on a house, but if the money you spend on the repairs is too great, your profit could be diminished when it comes time to sell. The same is true for remodeling and improvement projects. There are various renovation financing loans available to you that can help with the costs of home repairs, though extra consultations, inspections, and appraisals are often required in the process of securing these loans. Ultimately, if you can only afford a home that demands major improvements, and you don’t have the skills to do much of the work yourself, you may be better off renting.
Can you rent part of the house you’re buying?
If you buy a house with rental-capable space (extra bedroom, mother-in-law unit, etc.), you could use the rental income to pay off your mortgage faster and contribute more to your savings. But, of course, you need to be willing to share your home with a tenant and take on the responsibilities of being a landlord or working with a professional property manager to help you with those duties. Renting out a space in your home will also require you to purchase landlord insurance on top of your existing homeowners insurance policy.
Making Your Decision to Rent or Buy
At the end of the day, the decision is up to you. Based on the conditions laid out above, it simply may not be the right time for you to buy. Fortunately, when it comes to being a homeowner, it’s not now or never. I’m happy to be your resource in gauging whether it’s the right time to buy and guiding you through the process toward homeownership. To get started, connect with me today.
We earn the trust and loyalty of our brokers and clients by doing real estate exceptionally well. The leader in our market, we deliver client-focused service in an authentic, collaborative, and transparent manner and with the unmatched knowledge and expertise that comes from decades of experience.
© Copyright 2025, Windermere Real Estate/Mercer Island.
Adapted from an article that originally appeared on the Windermere blog April 11, 2022.
How’s the Market? Q2 2025 Review of Seattle Area Real Estate

The end of our spring market quieted down significantly as warm weather, graduations, and vacations distracted buyers and kicked off our typical summer slowdown. Despite this, Seattle posted modest year-over-year growth in both sales activity and median sales prices. The Eastside saw slight dips in sales prices and activity compared to last spring, but choice homes still sold quickly and most closed at or above their listed prices. Buyers found more room to negotiate, particularly on properties that needed work or otherwise didn’t generate immediate interest.
Our takeaways for Sellers: pricing strategy and early market momentum matter—homes that sell quickly are fetching the highest prices. Preparation and accurate positioning are key to success. For Buyers: There’s more inventory than last year, but the best homes are still moving fast and often over asking. Be ready to act decisively, especially in high-demand areas.
Click or scroll down to find your area report:
Seattle | Eastside | Mercer Island | Condos | Waterfront
SEATTLE
Seattle was a medal winner in the Q2 relay! Median sales price in Seattle hit $1.02M, up from $968K in Q2 2024—a 5% increase year-over-year, signaling a healthy and steadily appreciating market. Despite increased inventory, sales activity rose 3% YoY with 2,019 homes sold, reflecting stable demand. Homes that sold within the first 10 days received 105% of asking price, while those on market more than 30 days averaged just 97%, so speed continues to command premium pricing.
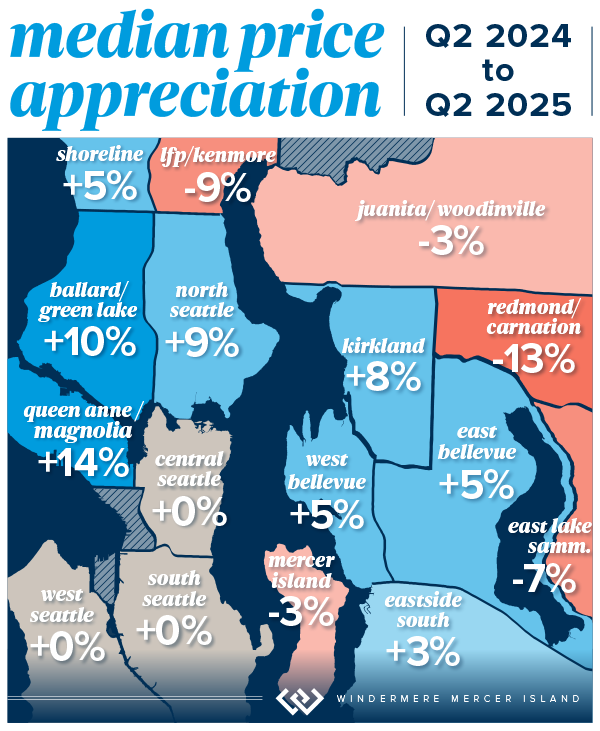
Momentum continues to be visible across several neighborhoods. Queen Anne & Magnolia led the city with a 14% price increase, pushing the median to $1.5m—a strong signal of those wanting quiet luxury near the downtown core. Ballard–Green Lake and North Seattle also saw notable gains, up 10% and 9% respectively. Central Seattle recorded a 6% increase in price per square foot and the highest number of units sold among central neighborhoods, showing a rebound in core urban demand. Lake Forest Park was the only area with a significant decline in median price (-9%) suggesting buyer opportunity in the near-north fringe.
Much like the Eastside, inventory jumped to 3,500 new listings in Q2, a 16% increase over Q2 2024, giving buyers more choices and slightly more negotiating room, especially for homes that linger on market.
The Seattle market in Q2 2025 showed measured growth, more listing activity, and resilient demand. Whether you’re buying or selling, strategy, timing, and clarity on your market segment are what will make the difference.
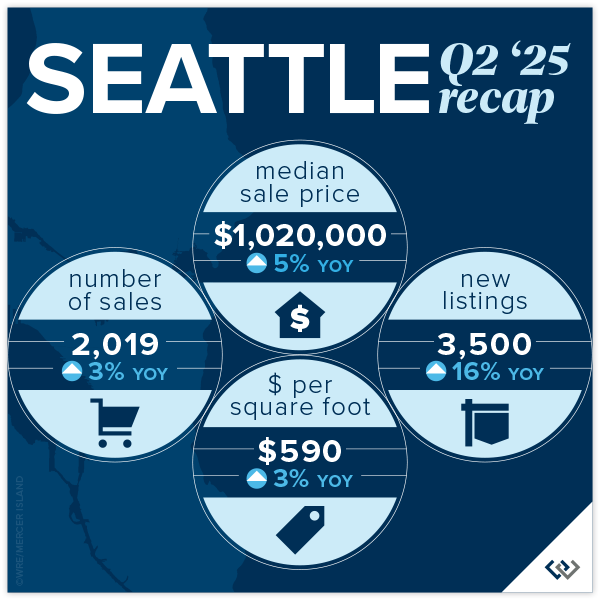
Click here for the full report and neighborhood-by-neighborhood statistics!

EASTSIDE
There was a listing surge this quarter and that was most significant on the Eastside! 3,194 homes were available—a substantial jump from just 2,509 in Q2 2024. This equates to a 27% increase in supply year-over-year. For buyers, there was more to choose from this quarter coupled with buyers being more selective and price sensitive. While competition is still strong, longer market times and slight price softening in some areas mean buyers have more negotiating power—especially in markets like Redmond and Sammamish.
But don’t rule out the homes priced and prepped well! Sales velocity remained strong, with 67% of homes selling at or above list price, and most (66%) selling within the first 10 days. 39% of homes even sold over asking price. The median sale price across the Eastside was $1.65M, slightly down from $1.67M last year (–1%), showing a stable but price-sensitive market. For those homes with a longer market time (over 30 days) on average, sellers took a 3% negotiation.
Areas like Sammamish (–7%) and Redmond (–13%) experienced the most significant price drops—indicating opportunities for buyers who are priced out of West Bellevue or Kirkland. If we’re talking community standouts, West Bellevue leads the pack in pricing, with a median sale price of $3.75M, up 5% year-over-year, and the highest price per square foot at $1,151. Kirkland saw the largest year-over-year price increase, up 8%, pushing the median to $2.19m. Redmond was the only major submarket to experience a notable increase in number of homes sold (+15%), despite a 13% price drop, suggesting high buyer demand for more affordable options.
Q2 2025 brought more listings and more choices, but the market remains fast-moving and price sensitive. Our takeaways for Sellers: pricing strategy and early market momentum matter—homes that sell quickly are fetching the highest prices. Preparation and accurate positioning are key to success. For Buyers: There’s more inventory than last year, but the best homes are still moving fast. If the home is listed, the seller is ready to make a deal. Whether you’re buying or selling, strategy, timing, and clarity on your market segment are what will make the difference.
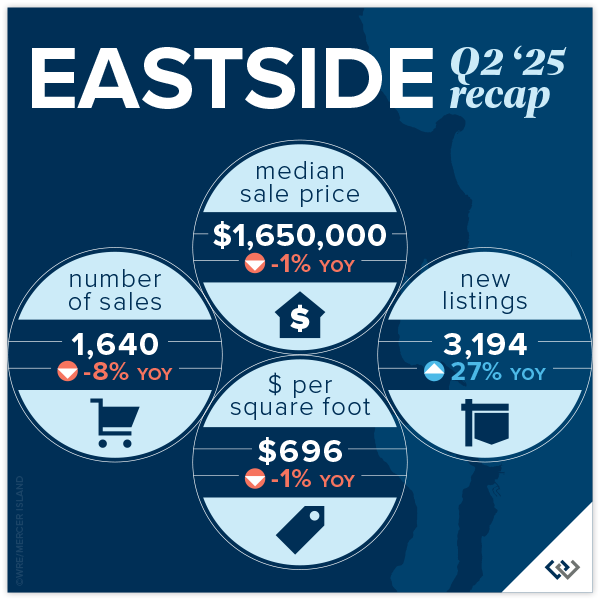
Click here for the full report and neighborhood-by-neighborhood statistics!
MERCER ISLAND
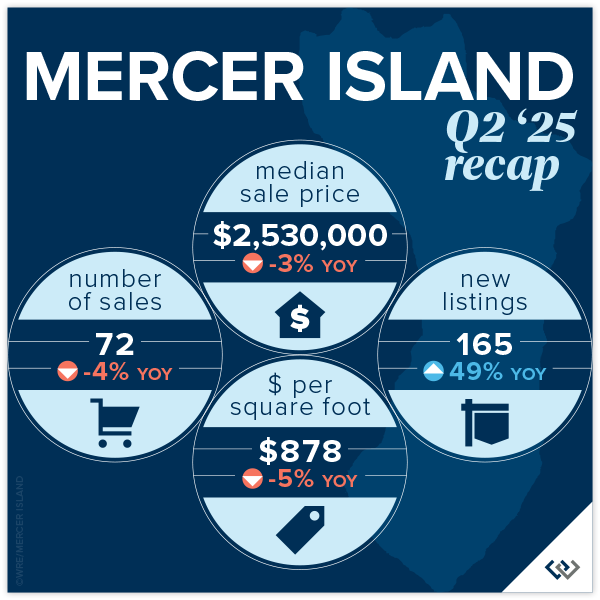
Mercer Island’s Q2 2025 market remains robust, especially for well-positioned single-family homes. As predicted, those homes that were prepped well and priced strategically found serious buyers quickly—many selling within the first 30 days. 64% of homes sold at or above their list price this quarter, a strong signal that sharp pricing and smart timing paid off.
What’s less visible in the headline numbers is that 38 of the homes listed in Q2 are still active today. This speaks to the importance of days on market as a key driver: homes that sold within the first 10 days (71% of sales) received 102% of asking price, while those on the market longer than 30 days fetched just 96%. A 4% negotiation window suggests buyers are discerning, and sellers may be responding to increased competition while planning for a typical summer slowdown.
With 72 residential sales, Q2 showed a healthy level of activity, but overall urgency softened, leading to downward pressure on pricing. The median sales price slipped to $2,530,000 from $2,937,000 in Q1, showing that the early-year momentum didn’t carry through Spring. Still, when compared to Q2 2024’s $2.5m, pricing has remained remarkably resilient.
Neighborhood standouts: the Westside led the market with strong price per square foot and intense buyer interest – 5 of the 6 homes sold within the first 10 days. The North End saw the highest sales volume with 14 homes sold, proving to be a consistent favorite. The South End offered 7 sales at a reasonable price per square foot of $722 vs. the North End’s $885 per foot.
While the data shows a seller-leaning market, buyer demand is unpredictable. With an uncertain Fall market ahead, sellers should prepare for longer market times, and bring patience along with their listing prep. Buyers, on the other hand, should know that opportunities exist across the island, especially in the condo sector, where activity is softer and pricing may be more approachable for those looking to establish a foothold on Mercer Island.
Click here for the full report and neighborhood-by-neighborhood statistics!

CONDOS – SEATTLE & EASTSIDE
Condos remained an accessible entry point for buyers across our region, with Q2 marking a strong showing. In Seattle, the most robust demand was found in more affordable neighborhoods like South and North Seattle—North Seattle alone saw a 24% jump in median price. Meanwhile, the luxury condo segment in Downtown Seattle moved more slowly, with average price per square foot landing at $794.
On the Eastside, the condo market felt uneven but held its value overall. While pricing trends varied by submarket, Eastside condos continued to outperform Seattle in overall price strength. Woodinville and Redmond stood out with impressive gains, while Mercer Island saw a softer quarter with just four sales and a median price dipping to $618K.
Sales activity rose 7% on the Eastside and 5% in Seattle compared to last year. Homes that sold within the first 10 days garnered the most attention, suggesting well-priced listings are still commanding strong interest. In Seattle, 53% of condos sold at or above list price; on the Eastside, that number climbed to 58%—a clear sign that buyers are negotiating in a competitive environment and pricing remains fluid.
With the single-family market still tight, condos—particularly those priced under $700K—continue to offer buyers a compelling path to homeownership in desirable neighborhoods.
Check out area-by-area details in the full condo report.

WATERFRONT
Lake Sammamish and Eastside waterfront saw a busy Q2 with 13 and 9 sales respectively. After a big Q1, Seattle waterfront sales slowed in Q2 with just 4 sales (as opposed to 10 last quarter). Mirroring the overall market, waterfront saw some softening on price—the vast majority of homes sold at or below their list prices with just a few choice properties attracting bidding wars.
Yarrow Point garnered the largest sale price of $13 million for an immense Cape Cod inspired estate encompassing over half an acre, 7,465 sq. ft. of interior living spaces, and 82 feet of prime low- to no-bank waterfront. Lake Sammamish offered the best bargain—an original 1975 lake house on 1/3 acre with 50 feet of waterfront that was snagged for $2.6 million.
This brief overview of the entire Seattle-Eastside private waterfront market, including Mercer Island and Lake Sammamish, illustrates the trends occurring in our region over time. This data is interesting and insightful but cannot replace an in-depth waterfront analysis with your trusted professional.
View the full waterfront report

We earn the trust and loyalty of our brokers and clients by doing real estate exceptionally well. The leader in our market, we deliver client-focused service in an authentic, collaborative, and transparent manner and with the unmatched knowledge and expertise that comes from decades of experience.
© Copyright 2025, Windermere Real Estate/Mercer Island. Information and statistics derived from Northwest Multiple Listing Service and Trendgraphix, and deemed accurate but not guaranteed. Seattle cover photo courtesy of Codi Nelson, by HD Estates Photography. Eastside cover photo courtesy of Fred Fox & Julie Wilson by Bobby Erdt, Clarity Northwest Photography. Mercer Island cover photo courtesy of Janet Bell & Julie Wilson, by Bobby Erdt, Clarity Northwest Photography. Condo cover photo courtesy of Luke Bartlett, by Kealin Branson, Clarity Northwest Photography. Waterfront cover photo courtesy of Nancy LaVallee, by Amaryllis Lockhart, Clarity Northwest Photography.
How to Price Your Home for Sale

The right listing price is absolutely critical to a successful home sale. Price too high and you will miss your shot to generate interest with a sense of urgency for buyers—often, overpriced listings languish on the market and end up selling for less than they would have if they’d been priced more competitively from the get-go. Price too low, however, and you risk leaving money on the table if your home doesn’t attract multiple offers. So how do you price it right?
As agents, we track market conditions daily to understand where the “Goldilocks zone” lies for different neighborhoods and price points based on buyer demand and competing properties. Your best bet is to work closely with your agent on an effective pricing strategy before listing your home…BUT in the meantime, here’s some info to help you better understand what goes into this process.
- Understanding the Value of Your Home: Market Value vs. Assessed Value and More
- The Difference Between a Comparative Market Analysis and an Appraisal
What’s your home worth?
While nothing can replace an in-person evaluation by a real estate agent or appraiser, automated valuation models (AVMs) can be a helpful first step in determining what your home is worth. AVMs assess your home by comparing its information with the listings in your area. An algorithm can’t possibly know about the unique characteristics of your home or its neighborhood…but it can give you a rough ballpark idea of your home’s value and how it’s changing over time. Curious? Try my Home Worth Estimator here:

What factors influence home prices?
Understanding what factors influence home prices will give you a deeper knowledge of the market, give clarity to the selling process, and help you work with your agent to accurately price your home.
Comparable Home Sales
Comparable home sales—or “comps”—have a major impact on the price of your home. Comps refer to the comparable homes in your area, both pending and sold, within the last six months. I can provide you with a Comparative Market Analysis (CMA) to better determine the price of your home. CMAs factor in aspects such as square footage, age, and lot size compared to other homes in your area, to determine how your home should be priced among the competition. Reach out if you’d like to request one.
Your Home’s Location
Location, location, location. It plays one of the most significant roles in your home’s asking price. Market conditions in your area, whether you reside in a metropolitan, suburban, or rural location, and the home’s proximity to amenities, schools, and entertainment all contribute to the price.
Your Home’s Condition
If you have recently invested in upgrades or other remodeling projects for your home, they could increase your asking price. However, the price increase potential depends on the kind of renovation, its ROI, and how valuable it is to buyers in your area. If the home needs repair, it will likely generate less interest from buyers than better maintained homes at your price point. Any outstanding repairs or projects looming overhead will make the home less attractive to buyers and could lead to a low appraisal.
Seasonality
Any factors that impact market supply and demand are worth taking into consideration when preparing to price your home, and seasonality is one that cannot be overlooked. Typically, market activity slows in the winter and picks up during the spring and summer months. For more in-depth info, check out these articles on The Best Time to Buy or Sell a Home and Timing the Market.
Market Conditions
Finding a competitive listing price will be depend on local conditions, such as whether it’s a buyer’s or seller’s market. Some sellers think that pricing their home over market value means they’ll sell for more money, but the opposite can often be true. Overpricing your home presents various dangers such as sitting on the market too long, which can result in selling for well below what it’s worth.
Periodic Price Adjustments
Pricing a home isn’t a set-it-and-forget-it proposal. As with any strategy, you need to be prepared to adapt to fast-changing market conditions, new competition, a lack of offers, and other outside factors.
These are the basic tenets for understanding what goes into the price of a home. When you’re ready, I can interpret and expand on this information, perform a CMA for your home, and guide you throughout your selling journey.
Adapted from an article originally appeared on the Windermere blog October 5, 2022.
We earn the trust and loyalty of our brokers and clients by doing real estate exceptionally well. The leader in our market, we deliver client-focused service in an authentic, collaborative, and transparent manner and with the unmatched knowledge and expertise that comes from decades of experience.
© Copyright 2025, Windermere Real Estate/Mercer Island.
How’s the Market? Q1 2025 Review of Seattle Area Real Estate

Q1 started the year off strong for Seattle-area real estate with the majority of homes selling in the first 10 days on the market and for at or above their listed prices. Median sales prices were also up compared to Q1 of last year. Buyers enjoyed more choice with new listings outpacing sales, steadily increasing our supply of available homes for sale.
What the numbers don’t show yet is that the spring market sprang early, in January and February; now that prime inventory is hitting the market, demand appears to be waning. Our advice to Home Shoppers: don’t take any chances. Just because the last new listing didn’t sell in a competitive situation, doesn’t mean the next one won’t. If you love the home, act with confidence. Our advice to Home Sellers: don’t take any chances. Prep well, price appropriately, and take that first buyer seriously. It’s unpredictable out there.
Click or scroll down to find your area report:
Seattle | Eastside | Mercer Island | Condos | Waterfront
SEATTLE
The Seattle real estate market continues to show encouraging signs of strength and stability as we step into 2025. Median home prices rose 6% year-over-year to $960,000, building on the 9% increase we saw in Q1 2024 and rebounding from $830,000 in Q1 2023. That’s a remarkable $130,000 gain in just two years. Inventory is also trending in the right direction, with 2,293 new listings this quarter—up 14% from Q1 2024 and significantly higher than the 1,958 new listings in Q1 2023. It appears that need is outweighing the pull of a sub 3% interest rate when considering whether or not to make a move.
Momentum is visible across several neighborhoods. West Seattle, for instance, saw 75% of homes sell at or above list price (up from 71% last year and 70% the year before), while North Seattle maintained its reputation for competitive sales—70% sold at or above list and 66% sold in the first 10 days. Madison Park & Capitol Hill remained a strong performer with an impressive median price of $1,100,000; holding steady year-over-year after a 10% jump last year.
Citywide, 71% of homes sold at or above list price—up from 69% in Q1 2024—and the average price per square foot increased to $580, up 2% from last year. Quick market movement also continues to be a theme, with 62% of homes going pending in the first 10 days.
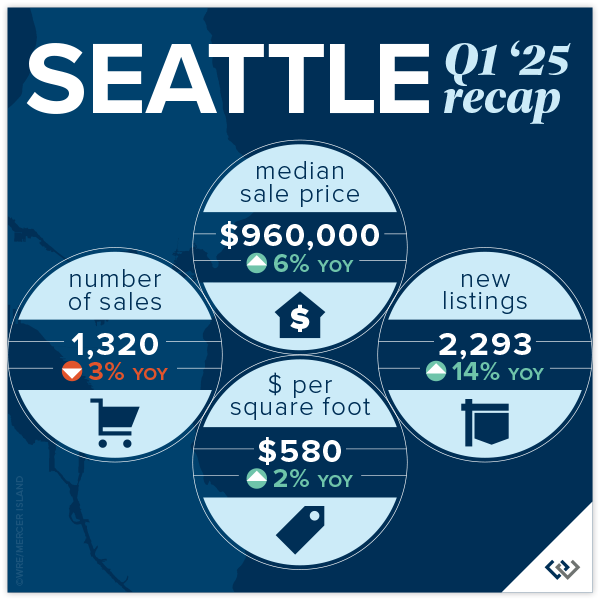
Click here for the full report and neighborhood-by-neighborhood statistics!

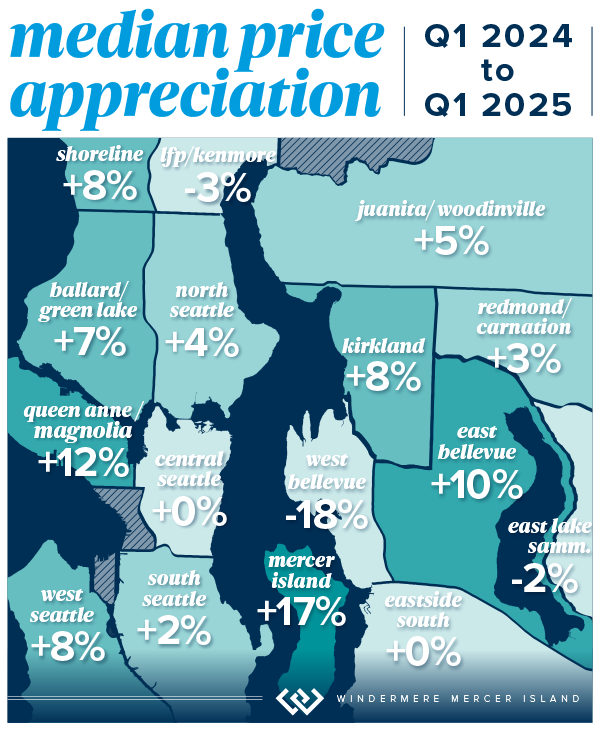
EASTSIDE
The Eastside market continues its upward momentum, with a 5% year-over-year increase in median sale price to $1,680,000 in Q1—building on the 14% jump reported in Q1 2024 and the remarkable recovery from Q1 2023’s $1,400,000 low. This marks a $280,000 increase over two years, a clear signal of sustained buyer demand and market strength.
Homes are moving quickly, with 69% selling in the first 10 days—up from 65% last year. Additionally, 72% of homes sold at or above list price, improving consistently from 68% in 2024. East Bellevue (E of 405) stood out with 83% of homes selling in the first 10 days and a 10% jump in median price—continuing its leadership in market competitiveness in recent years.
We also saw notable activity in Redmond, where sales rose 10% and 75% of homes sold in the first 10 days. Kirkland held strong as well, with an 8% increase in median price to $2.21M after last year’s 32% gain. And despite West Bellevue’s sharp 18% price dip, it remains one of the most valuable submarkets with a median price of $3,200,000.
The listing count jumped 21% year-over-year, with 1,833 homes hitting the market—finally turning a corner after multiple years of historically low inventory. Overall average price per square foot also increased 4% to $699.
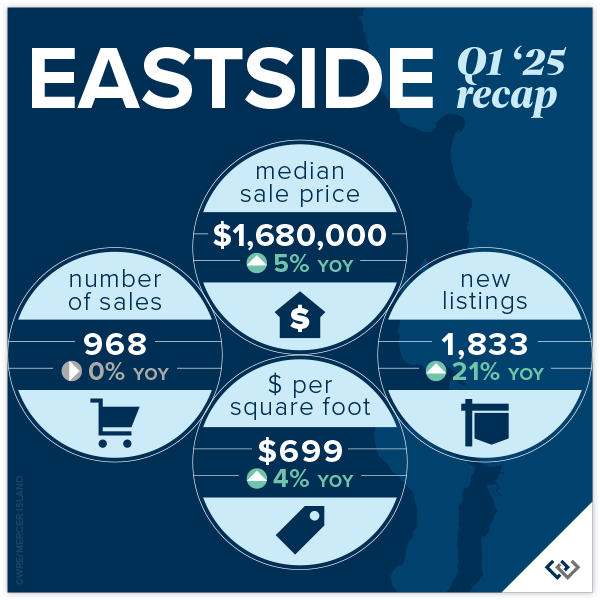
Click here for the full report and neighborhood-by-neighborhood statistics!

MERCER ISLAND
Mercer Island’s real estate market launched into 2025 with remarkable momentum. Median sale prices surged 17% year-over-year to $2,937,000—outpacing both Q1 2024’s 13% growth and 2024’s full-year 11% rise. This continued appreciation reflects strong buyer demand and an increase in high-value transactions across neighborhoods like Southend and Northend, which posted some of the highest median sales at $4,401,000 and $4,012,000 respectively.
While total sales volume declined by 21% from Q1 2024, due in part to seasonally low inventory, the market remained highly competitive. Over half (53%) of homes sold within the first 10 days—down from 73% in Q1 2024 but still a strong indicator of buyer urgency. Likewise, 47% of homes sold at or above list price, a notable drop from last year’s 65%, but consistent with Q1’s evolving pace as buyers exercise more discretion amid shifting macro conditions.
Inventory began to bounce back with 66 new listings—12% more than Q1 2024—signaling renewed confidence from sellers. Price per square foot rose modestly by 4% to $846, continuing the stable value trend seen in prior quarters.
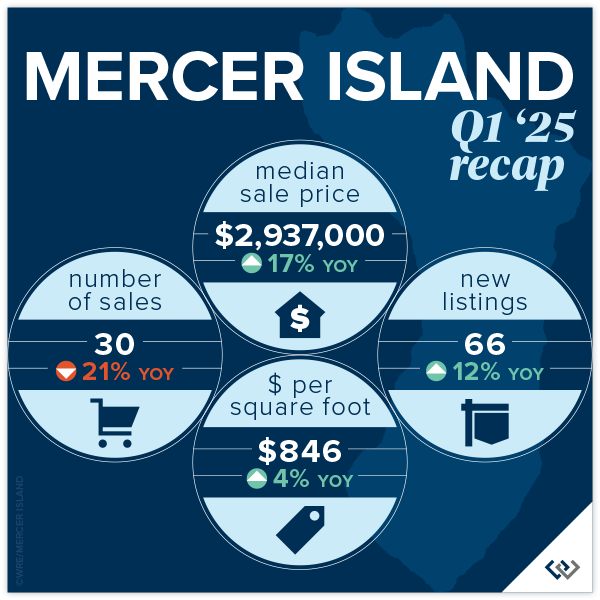 Click here for the full report and neighborhood-by-neighborhood statistics!
CONDOS – SEATTLE & EASTSIDE
The condo market is off to a strong and balanced start in 2025. With a 15% year-over-year increase in Seattle’s median condo price—now at $635,000—and a 9% increase on the Eastside to $735,000, it’s clear that confidence is returning to this sector. Seattle posted a 19% rise in condo sales, while Eastside transactions grew 15%, building on the momentum established last year. Go Seattle Go! We’re always rooting for downtown condo recovery.
Woodinville condos were the breakout stars this quarter, with a remarkable 108% rise in median sale price and 41% more units sold. Likely due to new construction projects in wine country. Redmond followed suit, reporting a 27% price jump and 36% growth in volume. Meanwhile, West Bellevue remains the most expensive submarket at $1,045,000, despite some pricing fluctuations. Seattle’s North End also had a strong showing, with prices up 3% and more than half of condos selling at or above list price.
In terms of competitiveness, Mercer Island stood out with 80% of its (5) sales happening in the first 10 days—up from 52% last year. This level of demand echoes across the Eastside, where 44% of homes sold within 10 days, up from 39% last year. Seattle mirrored this pace with 35% selling in the first 10 days.
Inventory has expanded as well. New condo listings rose 34% over last year, providing buyers with more choice while keeping upward pressure on prices. The condo market is proving to be as unpredictable as all things in the US today. There are certainly bright spots and it we are cautiously optimistic that Home Shoppers are considering condos a realistic option, unlike years past.
Check out area-by-area details the full condo report.

WATERFRONT
Seattle led the pack with 10 waterfront sales in Q1 of 2025, including the highest sale in the region—an immense 15,321 square foot Magnolia home on over 3 acres and 293 feet of waterfront that sold for $21,500,000. All but 3 of Seattle’s waterfront homes sold within the first 10 days on the market with one Lake Forest Park home going for $160,000 above the asking price.
The Eastside also posted some impressive Q1 sales, including a $16m Hunts Point sanctuary and a $13.125m Italian-inspired stunner at Mercer Island’s southern tip. The most modest waterfront sale was an original 1968 beach house on 58 feet of lakefront in Bellevue that sold for $1,750,000.
This brief overview of the entire Seattle-Eastside private waterfront market, including Mercer Island and Lake Sammamish, illustrates the trends occurring in our region over time. This data is interesting and insightful but cannot replace an in-depth waterfront analysis with your trusted professional.

We earn the trust and loyalty of our brokers and clients by doing real estate exceptionally well. The leader in our market, we deliver client-focused service in an authentic, collaborative, and transparent manner and with the unmatched knowledge and expertise that comes from decades of experience.
© Copyright 2025, Windermere Real Estate/Mercer Island. Information and statistics derived from Northwest Multiple Listing Service and Trendgraphix, and deemed accurate but not guaranteed. Seattle cover photo courtesy of Brooke Davis and Northwest’s Best Real Estate Video & Photography. Eastside cover photo courtesy of Joe C. Liu and Clarity Northwest Photography. Condo cover photo courtesy of Andrea Iverson and Andrew Webb, Clarity Northwest Photography.
How’s the Market? Annual Real Estate Review for the Seattle Area

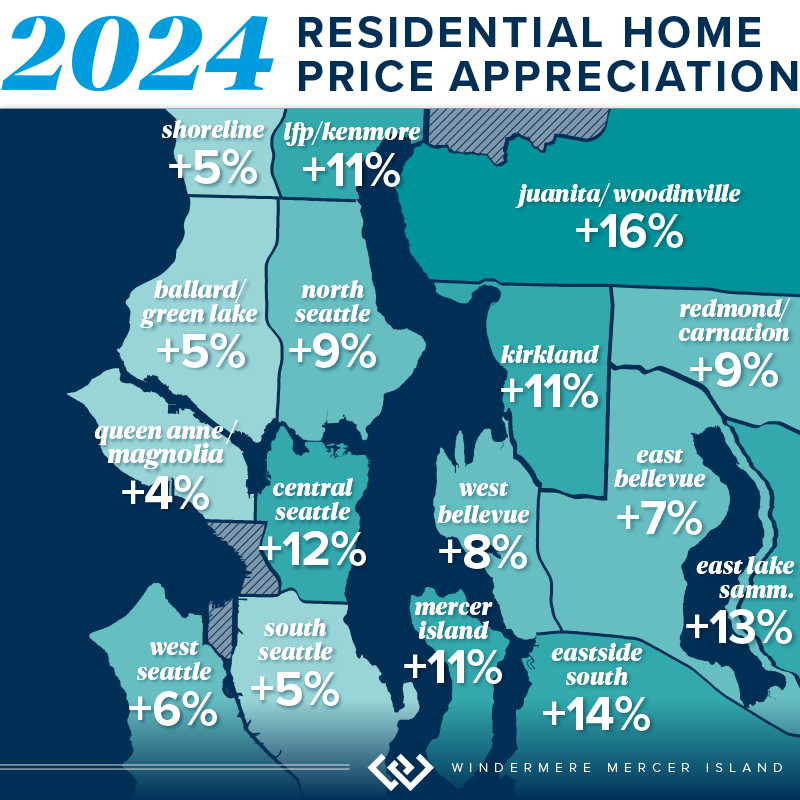
Happy New Year! Whew, we made it! With 2024 now in the books, we’re looking back fondly on a real estate market that showed positive signs of growth in virtually every sector. Median sales prices posted strong double-digit gains on the Eastside along with a healthy 8% rise in Seattle. Listings also rose, easing the strain for buyers grappling with our housing shortage.
If you’ve waited long enough and 2025 is the year for you to make a move, we recommend front loading that decision. Pent up demand (both sellers waiting to sell and buyers waiting to buy) should give us a spring full of blossoming and beautiful inventory. There is less volatility in interest rates than there has been in recent months, you’ll see that the average rate has been rock steady around 6.75% in 2023 and 2024. Overall, this is a great time to buy or sell and I am excited to help you!
Click or scroll down to find your area report:
Seattle | Eastside | Mercer Island | Condos | Waterfront
SEATTLE
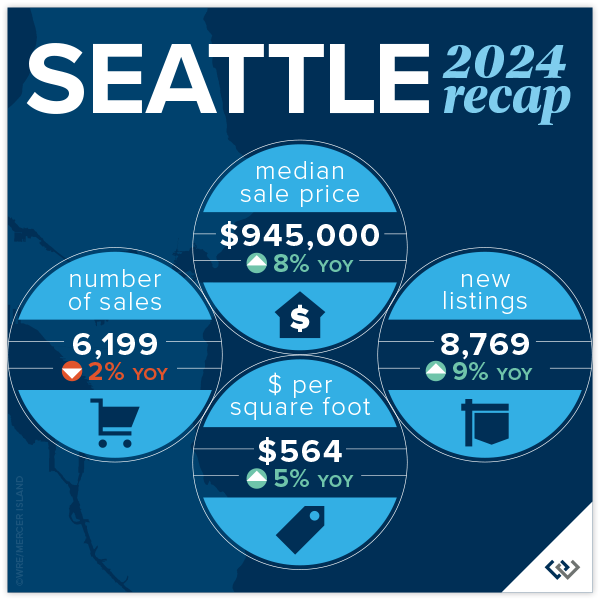
From a statistical/real estate perspective, the numbers don’t really reflect the overall vibe of the year. In a good way! It’s all positive news: prices are up, listings are up, and market time is down. The City of Seattle is in full recovery mode. Homeowners are awaiting the new density plan and eager to learn what the city has in store for the core neighborhoods around transit. It’s an exciting time. Median sold price city-wide reached a record $945,000 (modest, as that is $5000 above the previous record set in 2022) and homes sold for an average 104% of list price when they attracted a sale in the first 10 days (58% of the total sales).
Lake Forest Park and Madison Park saw the greatest price gains at 11% and 12% respectively. North Seattle was over all the “strongest” with 66% of homes selling in the first 10 days and 70% of homes selling for at or above list price. There was a modest gain in new listings across the board at 8769, while still lower than typical. The ten-year average is around 10,500 listings per year. No bad news here with average price per square foot gains of 5% to $564!
 Click here for the full report and neighborhood-by-neighborhood statistics!

EASTSIDE
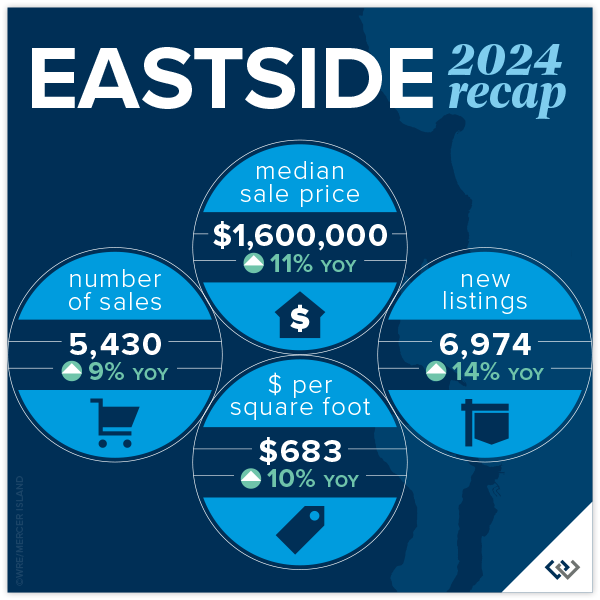
Welcome 2025! We (the real estate community) are feeling hopeful and bullish about what’s to come. So far, the numbers year over year support that. When we reviewed 2023 for the Eastside, the only positive statistic reported was Mercer Island’s 2% rise in the number of home sales. Looking at the 2024 report with that perspective it is ALL good news. New listings are up 14% for the year, while the number of sales are up nearly 10%. This is absorption of inventory to be excited about. Prices are up 11% to a record high of $1,600,000!
Woodinville and the area S of I-90 saw the largest price gains at 16% and 14% respectively, likely enjoying the benefits of buyers ‘pushing out’ because of the pressure of affordability in the core neighborhoods. Kirkland and West Bellevue were among the highest total sales and still a strong showing in price gains at 11% and 8%. Even though Bellevue (E of 405) saw the most modest price gains this was arguably the most popular neighborhood with 74% of homes selling in the first 10 days and 71% selling for at or above asking price!
 Click here for the full report and neighborhood-by-neighborhood statistics!
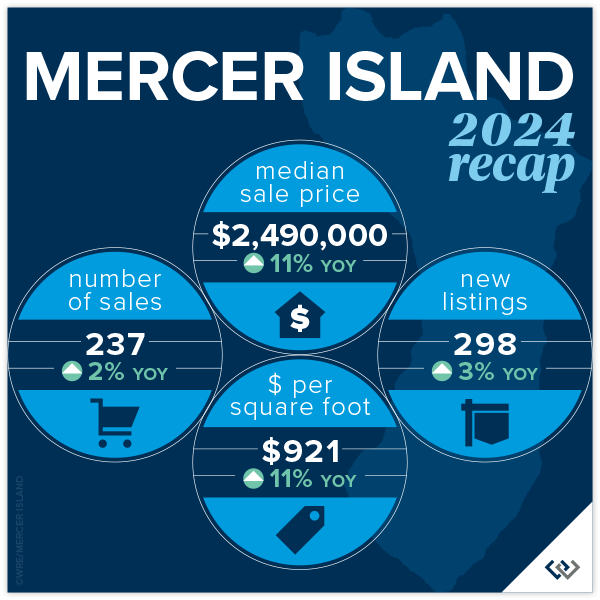
MERCER ISLAND
2024 was a solid year for Mercer Island: 11% overall price growth, on average 98% list to sales price ratio, and a respectable 32 cumulative days on market. This was a year of calm and confident decisions made by the entire real estate market. Home buyers and sellers alike. Looking to the neighborhoods there were two that stood out in relation to 2023: The Eastside and The Lakes where total sales had massive growth. 26 homeowners (vs 11 in 2023) moved on the Eastside and in the Lakes there were 4 transactions, a whopping change given that there were no sales reported on the MLS in 2023. The Island has not yet reached the peak prices from 2022, but we’re on our way!
Shifting to the condo market, 2024 was a sleepy year. With 47 new listings and 33 sales (both about 20% lower than in 2023), the average list to sales price ratio of 101% surprised us! Total median price is down YOY by about 8%, but with such little data to draw from this number tends to swing more than most. The overall price swing was from $339,000 for a studio to $1,775,000 for a 2 bedroom luxury unit. 19 of the 33 sales were 2 bedroom units. All in all condos on the island are a necessary market segment that we continue to watch closely as an overall indicator of market health.
 Click here for the full report and neighborhood-by-neighborhood statistics!
CONDOS – SEATTLE & EASTSIDE
In reviewing last years’ report, there was so much RED! This year is a refreshing change with some positive numbers sprinkled in. Even the pockets that remain flat feel like good news, after all, a push is a win! Perspective is everything, in life and in real estate. This year was absolutely a bright spot for condos in the last several months. This was due in large part to external factors: affordability issues in single family, perceived ‘high’ interest rates, continued density issues in the ‘burbs, and major employers recall to office. Urban life in both Seattle and on the Eastside are experiencing a renaissance and we’re here for it!
The headline in Seattle is that prices are UP! Downtown saw an increase of 8% to a median price of $650,000. Though, North Seattle carried the day with an eye popping 18% increase in median price. While price per square foot was flat on average, new listings are up 21% YOY. Sellers are dipping their toes back in the market at higher prices (up 5.3%) and seeing moderate success with total sales down 3% (compared to a 26% drop in 2023). Buyers know they have options and will wait to pick off the low hanging fruit: best perceived value for their dollar.
Meanwhile, on the Eastside: prices are up, listings are up, sales are up. A nice headline, but let’s break it down. New listings rose a whopping 34% year over year (which you may remember saw a 23% dip from 2022). Demand was steady with total sales up 15% YOY; we didn’t quite absorb all of the new inventory but that is to be expected. So, even with a relatively high absorption rate prices rose to a record high median of $695,000. The stars of this price gain are, not surprisingly, Kirkland and West Bellevue at 28% and 24% respectively. We can’t wait to see what 2025 will bring!
Check out area-by-area details the full condo report.

WATERFRONT
The Eastside saw a huge boost in waterfront sales with 50% more sold in 2024 than 2023. Mercer Island and Lake Sammamish posted similar sales gains of 45% and 43% respectively. While Seattle had 2 fewer sales than the year prior, its waterfront homes sold faster than in any other area and fetched higher selling prices as compared to list prices.
The highest waterfront sale was $38,900,000 for an immense 13,590 sq. ft. Medina estate on 117 feet of Lake Washington shoreline. The most modest sale was $1,400,000 for a 1960 Ralph Anderson original on Seattle’s Arroyo Beach.
This brief overview of the entire Seattle-Eastside private waterfront market, including Mercer Island and Lake Sammamish, illustrates the trends occurring in our region over time. This data is interesting and insightful but cannot replace an in-depth waterfront analysis with your trusted professional.

We earn the trust and loyalty of our brokers and clients by doing real estate exceptionally well. The leader in our market, we deliver client-focused service in an authentic, collaborative, and transparent manner and with the unmatched knowledge and expertise that comes from decades of experience.
© Copyright 2025, Windermere Real Estate/Mercer Island. Information and statistics derived from Northwest Multiple Listing Service and Trendgraphix, and deemed accurate but not guaranteed. Seattle cover photo courtesy of Michael Fleming and Clarity Northwest Photography. Mercer Island cover photo courtesy of The Sirianni Group and Clarity Northwest Photography. Condo cover photo courtesy of Luke Bartlett and Matthew Gallant, Clarity Northwest Photography.
