 Facebook
 Twitter
 Pinterest
 Copy Link

Buyers found no relief as our region’s extreme sellers’ market continued skyward. Strong home buyer demand simply outpaced the number of available properties for sale. Fierce competition drove prices up 15% in Seattle and a staggering 38% on the Eastside as compared to Q2 of 2020. While COVID played a factor in early 2020; all things considered, prices have increased substantially in the first half of 2021.
Home affordability, or unaffordability, is one of the most significant factors impacting our communities. Many first-time buyers, retirees, and moderate wage earners are finding the tri-county region of King, Snohomish, and Pierce Counties simply out of reach…or find themselves settling for accommodations that are far less than expected. The Seattle area, much like other high-priced markets across the country, has become a region where only the affluent can afford to own real estate.
As we move into the summer, buyer fatigue, coupled with COVID reopening of recreation and vacation opportunities, may provide much needed dampening of buyer demand. Our market desperately needs more balance between buyers and sellers in the market.
Click or scroll down to find your area report:
Seattle | Eastside | Mercer Island | Condos | Waterfront
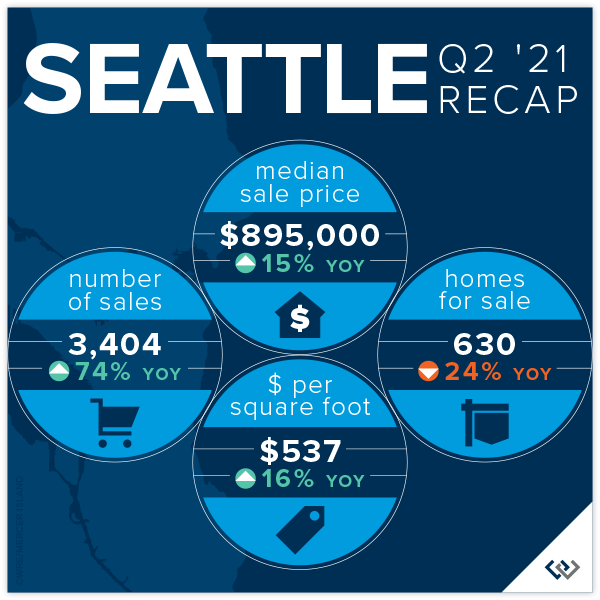
SEATTLE
Seattle’s Median Sale Price increased by 15% to $895,000 (up from $780,000 in Q2 2020). North end neighborhoods in Shoreline (+37%), Lake Forest Park-Kenmore (+37%), and North Seattle (+18%) outperformed the average while South Seattle (+9%), West Seattle (+11%). and Central Seattle (+12%) lagged slightly behind.
There was a 74% increase in the number of Seattle homes sold in Q2 (3,404) compared to Q2 2020 (1,956)—much of which can be attributed to COVID-related factors. Central Seattle (+116%) and West Seattle (+90%) had the largest increases in number of homes sold.
86% of all Seattle homes, and 33% of those priced above $1 million, sold at or above list, with the average of all homes sold at prices 6% more than list. Price increases were even more dramatic when homes sold in their first ten days on the market (76% of all listings) with an average sale price of 10% above list price. The most competitive neighborhoods were Kenmore-Lake Forest Park and North Seattle, with first 10-day sales averaging 15% and 13% above list price, respectively.
Click here for the full report and neighborhood-by-neighborhood statistics!
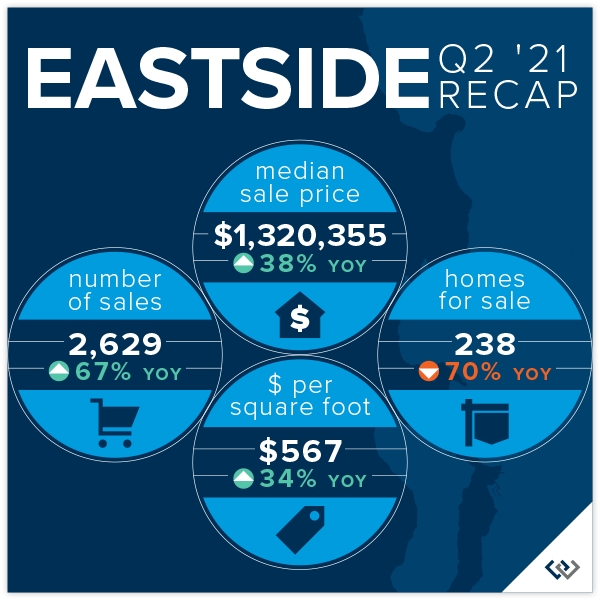
EASTSIDE
The Eastside’s Median Sale Price was $1,320,355 in Q2, up 38% over Q2 2020 ($958,000). Buyer demand outpacing the supply of homes for sale was the biggest factor fueling this increase. Redmond, (+48%), Kirkland (+48%), and South Eastside (+45%) saw the largest gains, while West Bellevue (+7%) had the smallest year-over-year increase.
93% of all Eastside homes, and 68% of homes priced above one million dollars, sold for at or above their list price. With 70% fewer homes for sale than in Q2 2020, the entire Eastside market remained ultra-competitive. The average of all homes sold was 9% above list price and homes sold within the first ten days went for an average of 13% above list price.
The Eastside market saw Months of Inventory (the number of months it would take to sell all homes currently for sale) remain at historical lows of between 0.3 and 0.4 months. Many Eastside communities have had only a handful of homes for sale at any one time.
Click here for the full report and neighborhood-by-neighborhood statistics!
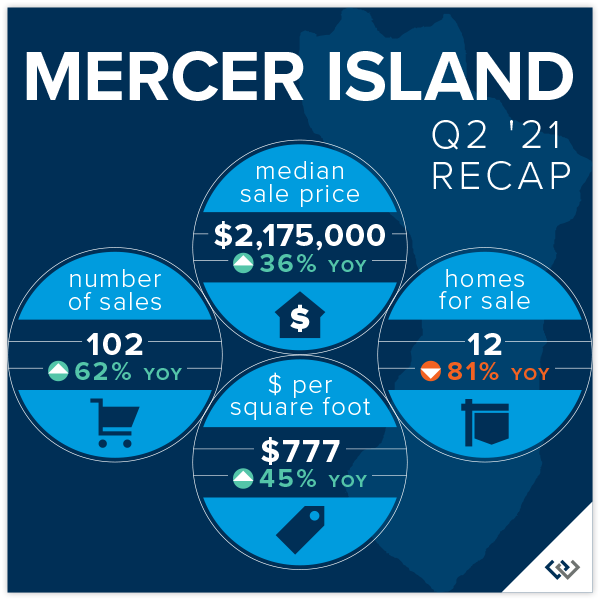
MERCER ISLAND
Fewer than two dozen homes for sale on the Island at any given time has led to a continued ultra-competitive market with 90% of all homes sold at or above their listed price. Those sold in the first 10 days on market (77% of all sales) closed for an average of 13% above their list price. Homes on the market 11-30 days sold for an average of 1% above list and homes on the market longer than 30 days sold for an average of 4% below their list price.
Click here for the full report and neighborhood-by-neighborhood statistics!
CONDOS – SEATTLE & EASTSIDE
Condo demand surged in Q2 as single-family home markets became more competitive, and in some cases, unattainable.
Seattle condos saw a 7% increase (to $488,750) and Eastside condos saw a 5% increase (to $550,000) in Median Sale Price compared to Q2 2020. Fueled by new construction development, South Seattle saw a three-fold increase in the number of condos sold, while the number of West Bellevue condos sold was up nearly double.
61% of Seattle condos and 80% of Eastside condos sold at or above their listed price. Those that were sold in the first 10 days (48% of Seattle and 70% of Eastside sales) sold for an average of 2% and 5% above their list price, respectively.
Check out area-by-area details the full condo report.
WATERFRONT
Waterfront listings were swooped up by buyers nearly as quickly as they came to market, some for staggering margins. Lake Sammamish had a record 18 sales while the Eastside had 17, Seattle 14, and Mercer Island had 7. Many waterfront homes went under contract in mere days, with an average market time in the teens instead of months.
As an indicator of demand in the luxury segment, most homes sold above their list price—something that historically has rarely happened in this sector. Some of most competitive homes sold for outrageously more than their list price as affluent buyers opened their pocketbooks for the win.
This brief overview of the entire Seattle-Eastside private waterfront market, including Mercer Island and Lake Sammamish, illustrates the trends occurring in our region over time. This data is interesting and insightful, but can’t replace an in-depth waterfront analysis provided by a savvy broker with years of local waterfront experience.

Find a Home | Sell Your Home | Property Research
Neighborhoods | Market Reports | Our Team
We earn the trust and loyalty of our brokers and clients by doing real estate exceptionally well. The leader in our market, we deliver client-focused service in an authentic, collaborative, and transparent manner and with the unmatched knowledge and expertise that comes from decades of experience.
2737 77th Ave SE, Mercer Island, WA 98040 | (206) 232-0446
mercerisland@windermere.com
© Copyright 2021, Windermere Real Estate/Mercer Island. Information and statistics derived from Northwest Multiple Listing Service and deemed accurate but not guaranteed.
